Data from Glassnode shows Ethereum is still experiencing negative momentum despite the year-to-date rise that the asset has observed.
Ethereum MVRV Ratio Has Recently Indicated Negative Momentum
According to the latest weekly report from Glassnode, the MVRV ratio has recently been below its 180-day moving average (MA). The “Market Value to Realized Value (MVRV) ratio” refers to an indicator that measures the ratio between the Ethereum market cap and realized cap.
The “realized cap” here is a capitalization model for ETH that assumes the true value of any coin in circulation is the price at which it was last moved on the blockchain. This is unlike the market cap, of course, which calculates the asset’s total value using the current spot price.
Since the price at which each coin was last moved on the network can be assumed to be the price it was bought, the realized cap can be looked at as a sum of the total capital that the investors have used to purchase ETH.
As the MVRV ratio compares the value that the holders are carrying right now (the market cap) against the amount that they have invested into the cryptocurrency, it can provide us with information about their profit/loss status.
Now, here is a chart that shows the trend in the Ethereum MVRV ratio, as well as its 180-day MA, over the last few years:
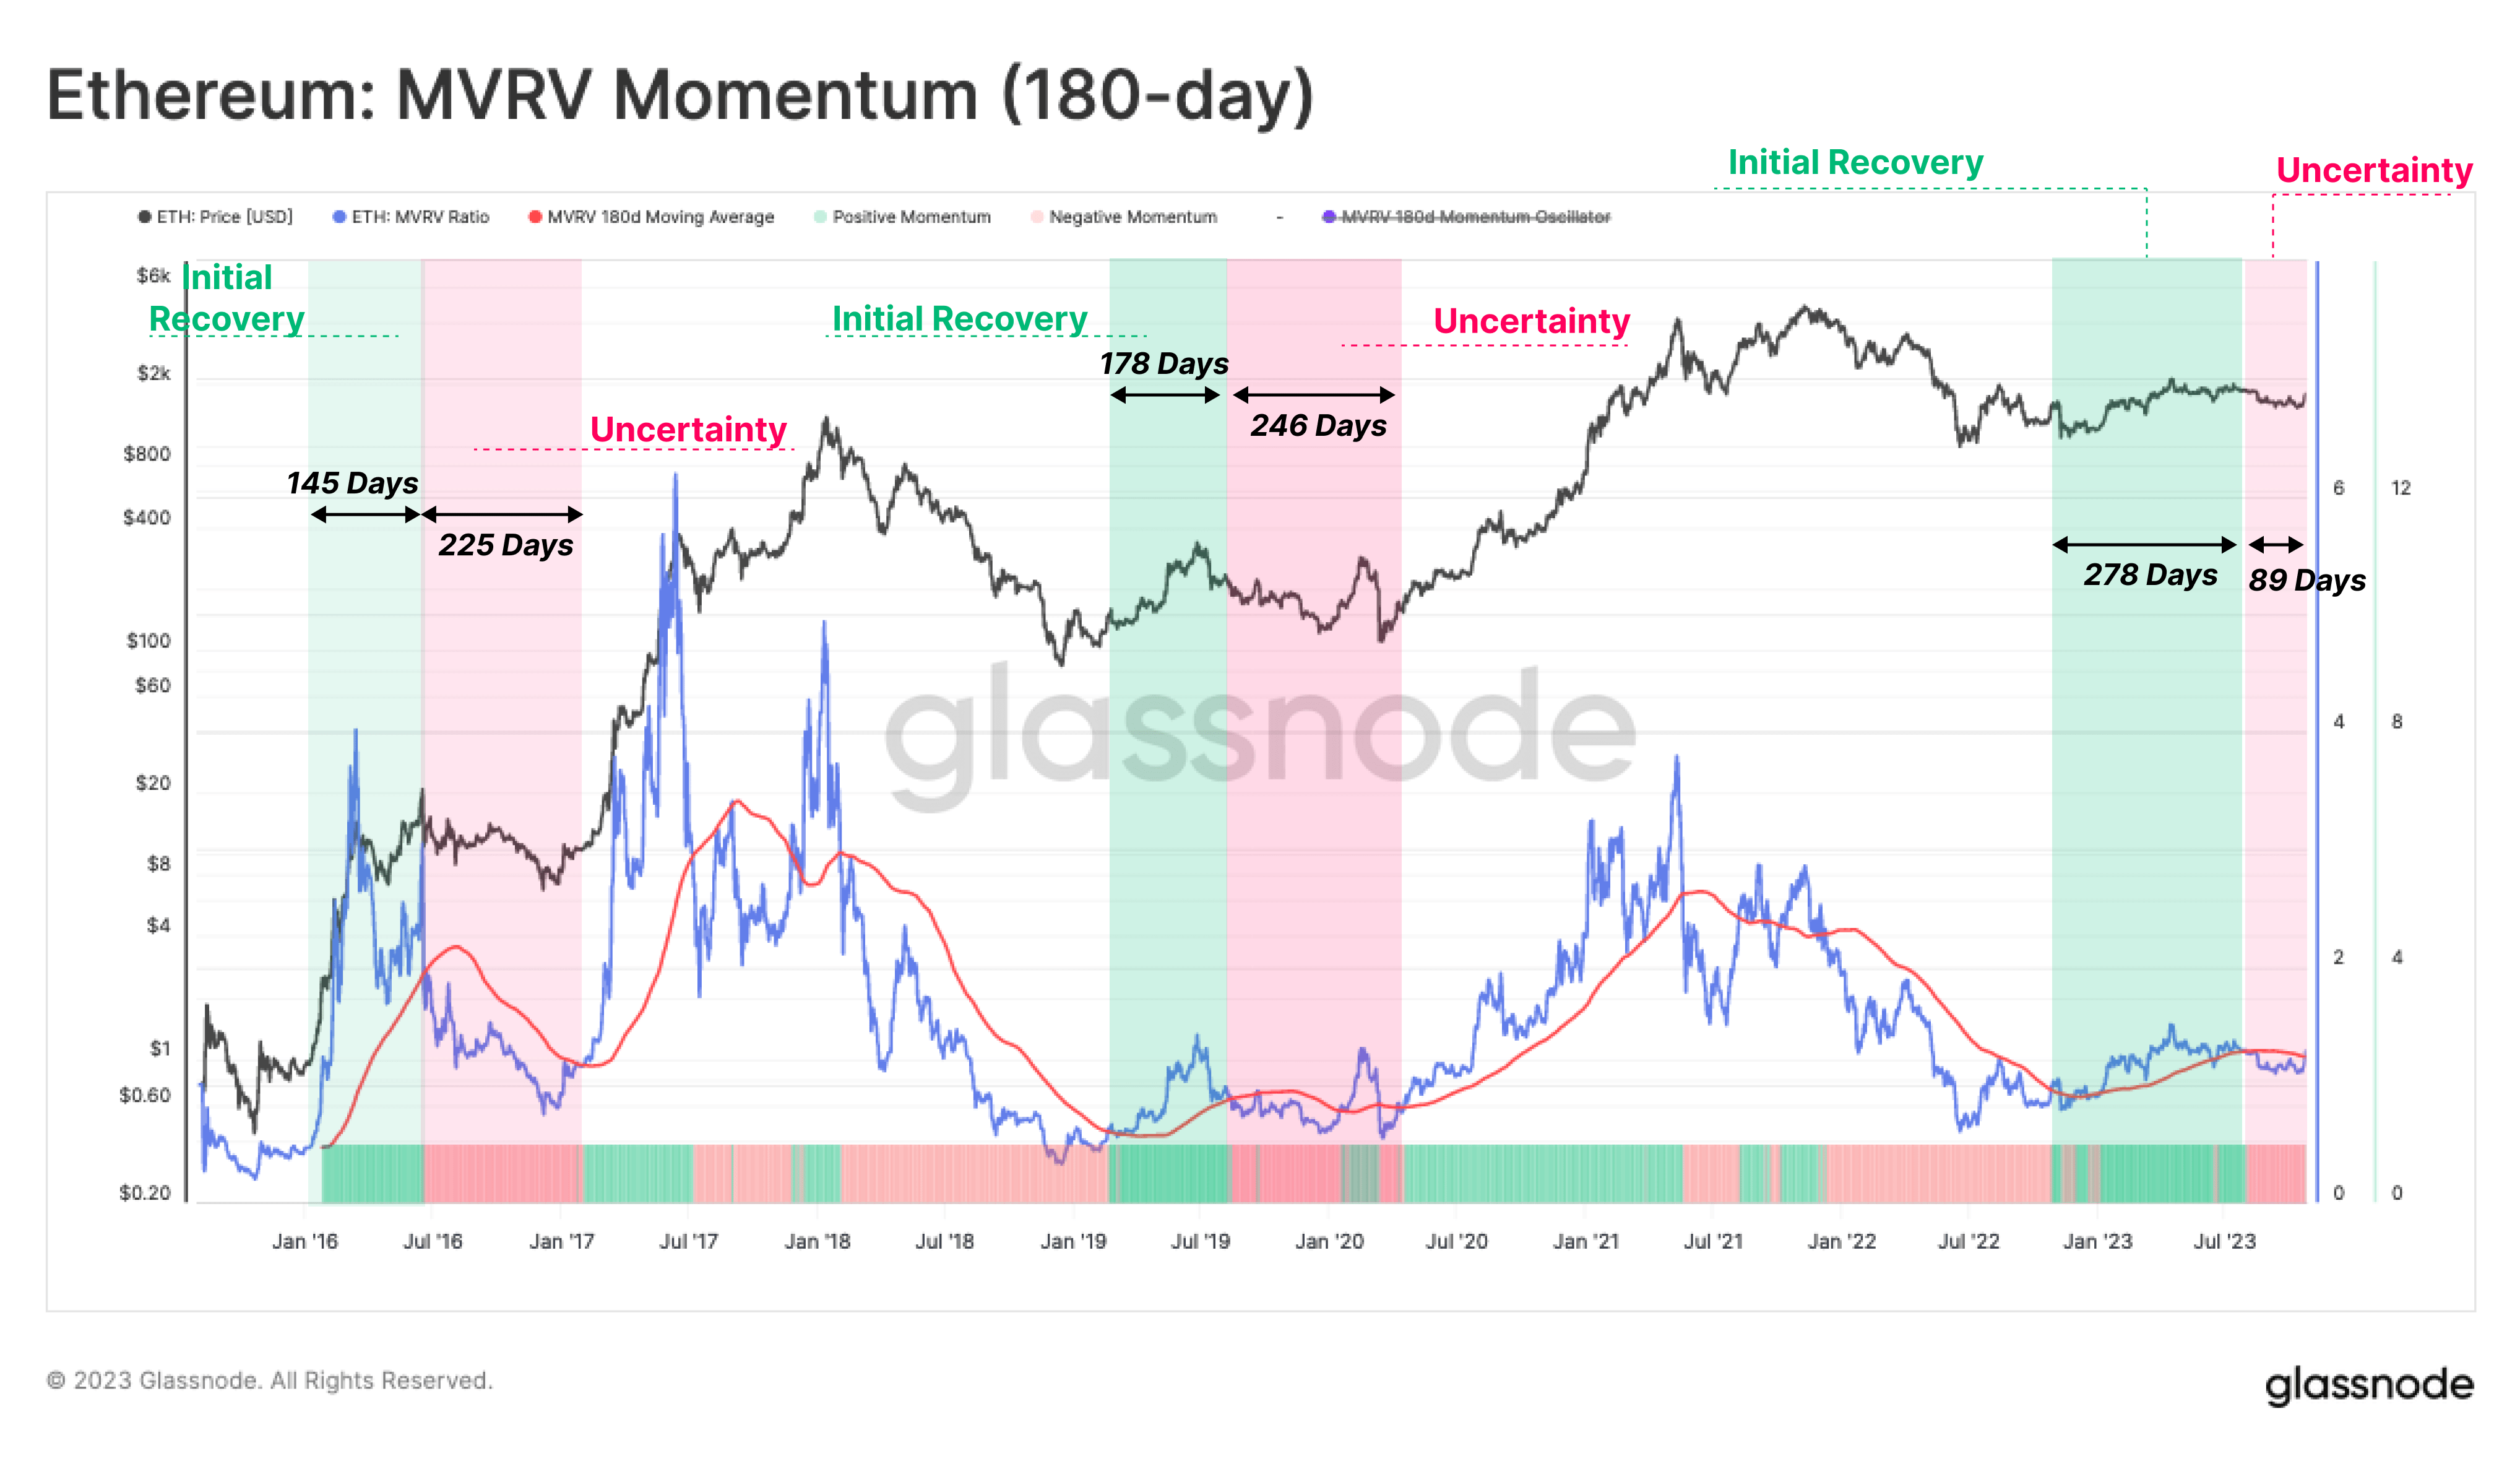
The two metrics have gone through a cross in recent days | Source: Glassnode's The Week Onchain - Week 44, 2023
When the MVRV ratio is above the 1 mark, it means that the average investor is sitting on some profits right now, while it being below the level implies the dominance of loss in the market.
From the graph, it’s visible that the Ethereum MVRV ratio observed some rise as the rally started at the start of this year. During this period, the indicator remained above its 180-day MA.
“Periods, where the MVRV Ratio trades above this long-term mean, indicate investor profitability is increasingly meaningful, and is often a signal of a rising market,” explains Glassnode.
In the last few months, though, as the Ethereum price has found some struggle, the metric has gone under its 180-day MA. The analytics firm notes, “despite the positive market performance for ETH YTD, by this metric the market is still experiencing negative momentum.”
As is apparent from the chart, the Ethereum MVRV ratio has very recently just started to break above this mark, following the rally towards the $1,800 level. It’s still very early in the breakout, though, so it’s unclear if it will actually sustain there.
“It seems that the hangover from the 2022 bear is still being slowly worked through,” says the report. It’s not something new that ETH is going through a phase like this; as the graph highlights, the asset has also faced similar periods of uncertainty in the past.
ETH Price
At the time of writing, Ethereum is trading around $1,800, up 1% in the past week.
ETH has enjoyed some bullish momentum recently | Source: ETHUSD on TradingView
Featured image from Kanchanara on Unsplash.com, charts from TradingView.com, Glassnode.com
- SEO Powered Content & PR Distribution. Get Amplified Today.
- PlatoData.Network Vertical Generative Ai. Empower Yourself. Access Here.
- PlatoAiStream. Web3 Intelligence. Knowledge Amplified. Access Here.
- PlatoESG. Carbon, CleanTech, Energy, Environment, Solar, Waste Management. Access Here.
- PlatoHealth. Biotech and Clinical Trials Intelligence. Access Here.
- Source: https://www.newsbtc.com/news/ethereum/ethereum-shake-off-bear-hangover-glassnode/

