SNEAK PEEK
- Bullish whales drive ETH’s rise, reinforcing market confidence.
- Increasing market cap and trading volume signify improved sentiment for ETH.
- Technical indicators suggest a potential buying opportunity amid ETH’s upward trend.
As the price of Ethereum (ETH) continued to rise, a significant whale made a substantial deposit of 23,080 $ETH, worth an impressive $44M, to Binance. This move was a clear indication of the confidence that the whale had in the Ethereum market. The average withdrawal price of $ETH at the time was around $1,820, which added to the overall bullish sentiment surrounding the asset.
After the price of $ETH rose, a whale deposited 23,080 $ETH ($44M) to #Binance 20 mins ago.
The average withdrawal price of $ETH is $1,820.https://t.co/ez9DE42zpo pic.twitter.com/O6Kg9MLBrL
— Lookonchain (@lookonchain) May 29, 2023
However, the bulls dominated the Ethereum market in the previous 24 hours, driving prices to an intraday high of $1926.42 despite the bear’s attempts to reverse the trend at an intraday low of $1839.13. At the time of writing, ETH’s price had risen by 2.81% to $1900.35 due to the ongoing bullish trend.
ETH’s market capitalization and 24-hour trading volume increased by 2.80% and 70.00% to $228,524,967,870 and $6,968,777,150, respectively. This action indicates a significant improvement in ETH’s investor sentiment and trading tactics.
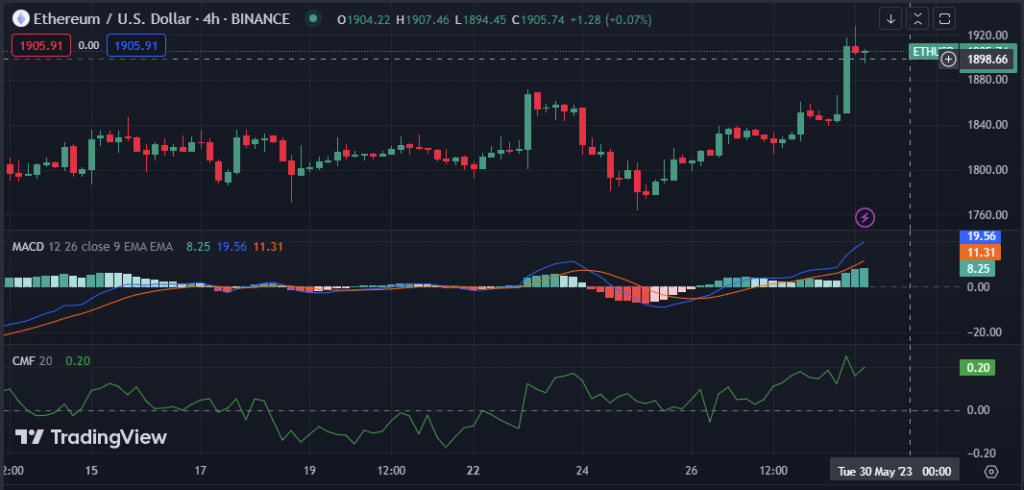
The MACD blue line’s reading of 19.48 and a move above its signal line reinforce the bullish position in the ETH market and point to a potential buying opportunity for traders looking to capitalize on the rising trend. If it breaks through its signal line, it can be a sign of a change toward a bearish mood, and traders may consider taking profits or minimizing losses.
The Chaikin Money Flow (CMF) trending North with a value of 0.20 suggests that the market’s bullish momentum might persist. This movement points to increased capital inflow, boosting traders’ confidence in the ETH market and convincing more investors to follow the upward trend.
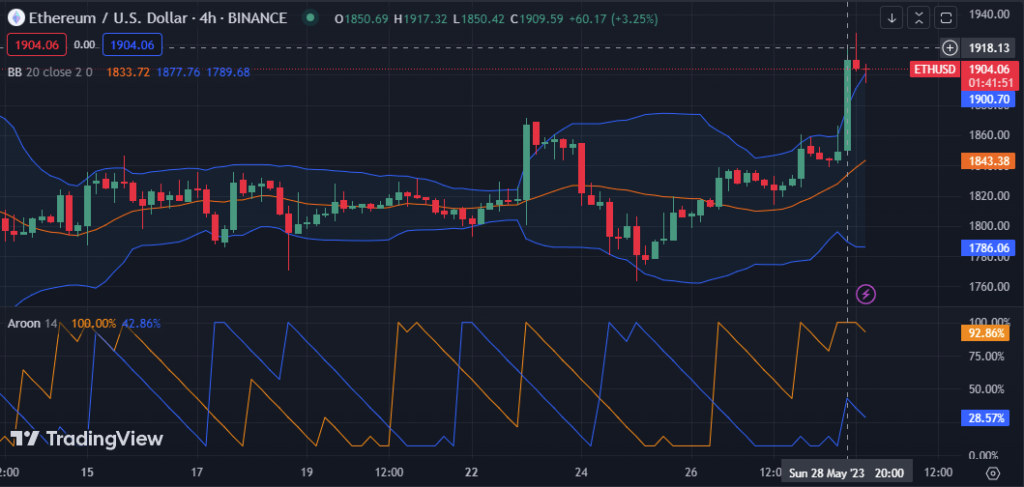
ETH is in a strong uptrend, as indicated by the Aroon up and down readings of 92.86% and 28.57%, and the buying pressure is anticipated to continue. However, this pattern indicates that traders should proceed cautiously and use stop-loss orders to protect themselves from any rapid changes in the market that can result in a price decline.
The Bollinger bands are widening and facing North on the 4-hour price chart of the ETH market with up and down readings of 1905.97 and 1785.74, respectively. This movement indicates a high level of volatility in the market, with prices fluctuating rapidly within this range. The movement of green candlesticks on the upper band indicates a bullish trend in the market.
In conclusion, ETH’s bullish run shows no signs of slowing down as whales demonstrate confidence with substantial deposits. Traders should stay vigilant and capitalize on potential buying opportunities while protecting against market fluctuations.
Disclaimer: Cryptocurrency price is highly speculative and volatile and should not be considered financial advice. Past and current performance is not indicative of future results. Always research and consult with a financial advisor before making investment decisions
- SEO Powered Content & PR Distribution. Get Amplified Today.
- PlatoAiStream. Web3 Data Intelligence. Knowledge Amplified. Access Here.
- Minting the Future w Adryenn Ashley. Access Here.
- Buy and Sell Shares in PRE-IPO Companies with PREIPO®. Access Here.
- Source: https://investorbites.com/ethereum-eth-price-analysis-29-05/

