SNEAK PEEK
- Ethereum is currently experiencing its highest level of self-custody since its introduction almost 8 years ago.
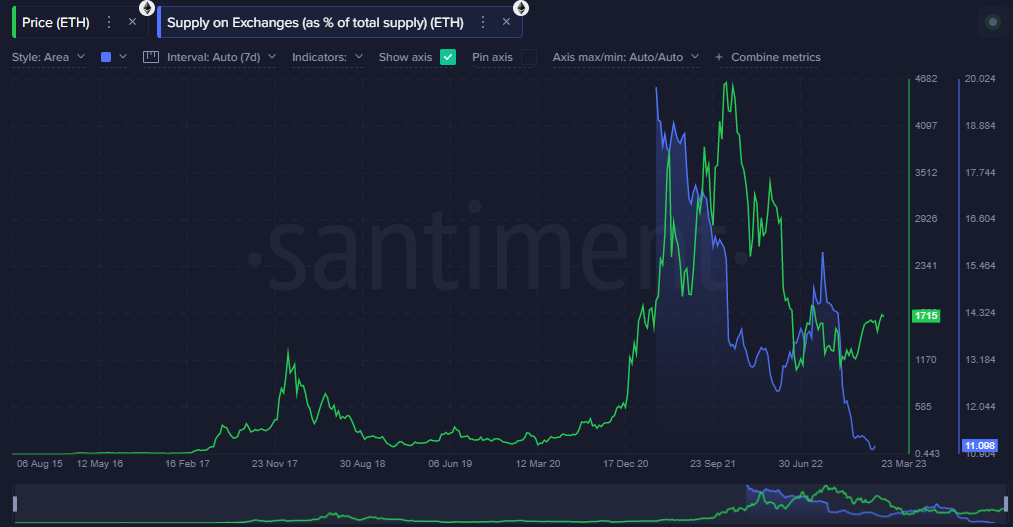
- The ratio of ETH on exchanges has hit an all-time low of 10.31%, suggesting hodlers have a strong level of confidence in the cryptocurrency.
- Ethereum price analysis shows a decline in price and has seen a decrease of 1.10% in the past 24 hours.
According to recent data, the amount of Ethereum being held in self-custody is currently at its highest level since the cryptocurrency was introduced nearly 8 years ago. The data indicates that investors are showing a high level of confidence in the cryptocurrency by choosing to hold onto their coins rather than trading them on exchanges. The ratio of ETH on exchanges has reached an all-time low of 10.31%, which suggests that there is less liquidity in the market.
This trend of self-custody could potentially drive up the price of Ethereum in the long run as the decreased liquidity may result in an increase in demand. However, the high level of self-custody also presents security risks for investors, as they are solely responsible for the safekeeping of their own coins. This could lead to increased interest in more secure and user-friendly self-custody solutions that benefit the wider cryptocurrency community.
Ethereum Technical Analysis
The latest Ethereum price analysis shows a bearish trend across the board. ETH is trading in a downtrend pattern, with the price declining by 1.10% in the past 24 hours and currently trading around $1,730. The crypto market has seen a major hit as the largest global exchange, Binance, gets sued by United States regulators for violating derivatives trading rules.
ETH is currently facing resistance at $1,769 but could maintain its levels above the $1,700 mark if the market sentiment regains and the bulls return. The current support for Ethereum is at $1,690, below the key support level of $1,700. A decline below this point could result in further price drops.
Despite the downtrend in the ETH/USD pair, the trading volume of Ethereum has seen a significant increase in the past 24 hours. The volume is recorded at 8.54 billion and has gained 18.30% over the past day. This could potentially be a sign of increased demand for Ethereum despite its overall bearish sentiment. The market capitalization of Ethereum remains at $211 billion, a downswing of 1.10% in the past 24 hours.
The technical indicators on the daily chart show the bulls are stumbling to defend the key support level of $1,690. The Relative Strength Index (RSI) is currently at 53.20, hovering around the neutral zone, indicating there is no clear market momentum.
The MACD has seen a bearish crossover, which could be indicative of further price drops. The Moving Average Convergence Divergence (MACD) line is currently below the signal line. Additionally, the moving average (MA) is above the current price of $1757, with the MA line descending, a sign that the bears are in control of the market.
Overall, Ethereum’s price analysis suggests that ETH is currently trading in a range between $1,690 and $1,769. If buyers manage to push Ethereum’s price out of the range and above the $1,769 resistance level, ETH could see some significant gains in the near term. On the other hand, if the price breaks below $1,690, Ethereum could face more losses in the near future.
Disclaimer: Cryptocurrency price is highly speculative and volatile, and should not be considered financial advice. Past and current performance is not indicative of future results. Always do your own research and consult with a financial advisor before making investment decisions.
- SEO Powered Content & PR Distribution. Get Amplified Today.
- Platoblockchain. Web3 Metaverse Intelligence. Knowledge Amplified. Access Here.
- Source: https://investorbites.com/ethereum-eth-price-analysis-28-3/

