SNEAK PEEK
- ETH sees resistance at a 90-day high of $1,779.92.
- MACD and Aroon signals suggest bullish momentum, but traders should watch for a potential reversal.
- ROC and RSI indicate a possible slowdown in bullish momentum and a likely decline.
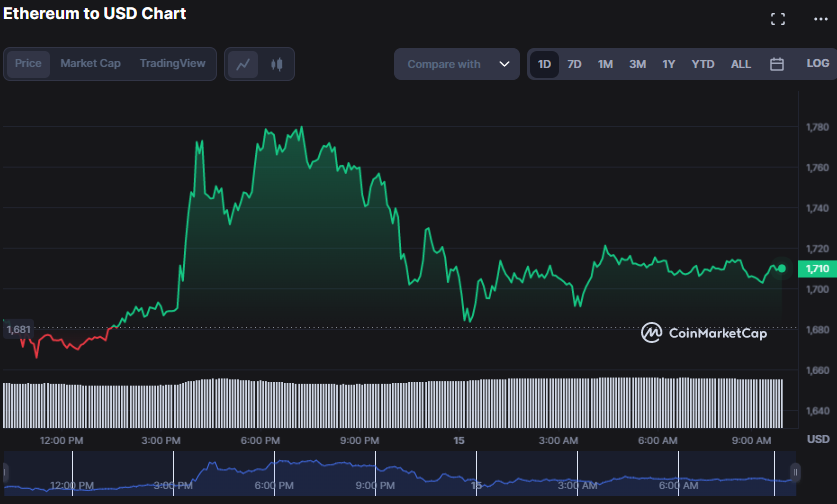
In the early hours of the day, bears had the upper hand in the Ethereum (ETH) market, causing the price to drop to a day low of $1,665.90.
Despite this drop, ETH bulls jumped in and successfully propelled the price to a 90-day high of $1,779.92 when resistance was encountered. Due to the failure to break resistance, ETH was valued at $1,708.98, a surge of 1.67% as of press time.
The market capitalization and 24-hour trading volume increased by 1.53% and 8.74%, respectively, to $209,111,933,725 and $15,920,900,707. This rise indicates that there is still a strong demand for ETH among investors, despite the resistance it faced.
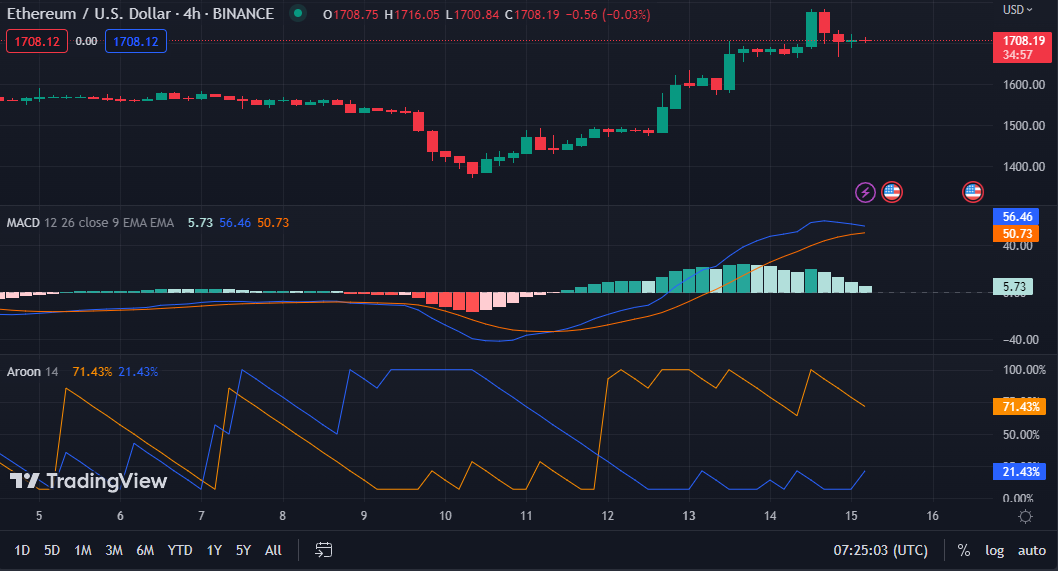
In the ETH/USD price chart, the MACD line moves above its signal line with a value of 56.49, showing that the present bullish trend is gaining pace and may continue soon. If the MACD goes below its signal line, the bulls may lose control, and a negative trend may develop soon, signaling a potential sell-off.
The histogram is in the positive zone, supporting this bullishness. However, as it is creating smaller bars from previous bars, the bullish momentum may be slowing down. Traders should follow the MACD attentively for any additional signals of weakness or a possible trend reversal.
As the Aroon up is 71.43% and the Aroon down is 21.43% on the ETH price chart, the bullish momentum is still strong, and the present trend may continue, but traders should keep a watch out for any possible resistance levels that might stall or reverse the trend.
Nevertheless, the movement north of the Aroon down, attempting to bridge the gap between it and the Aroon up, suggests that a trend reversal is probable soon. “Traders should also watch any negative indications that may emerge to prevent significant losses.”
The positive Rate of Change (ROC) motion on the ETH market illustrates the current optimistic feeling among traders and investors, who buy more ETH than sell, resulting in a rise in the cryptocurrency’s price.
Nevertheless, as it reads 1.46 and goes towards the “0” line, this might imply a potential slowdown in the positive momentum and a possible change towards a more neutral or pessimistic feeling soon, which could lead to a decline in the price of ETH.
Supporting this pessimistic picture, the Relative Strength Index (RSI) has formed a bearish crossing as it goes below its signal line reading of 65.34. This bearish crossover indicates that ETH bulls are losing momentum and that a possible decline is on the hori
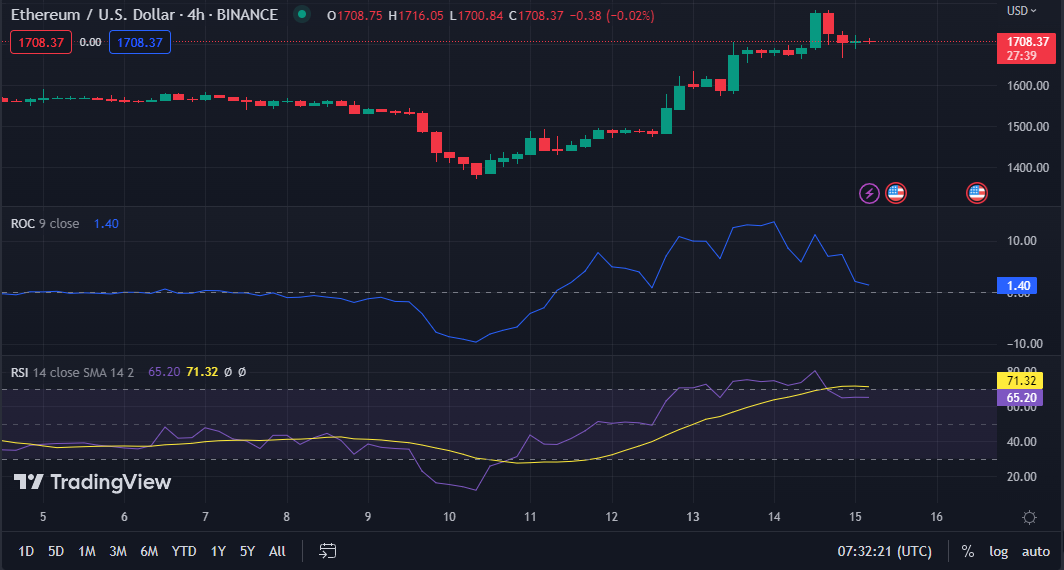
ETH bulls push to a 90-day high, but resistance halts the surge. MACD and Aroon suggest bullish momentum, while ROC and RSI indicate caution.
Disclaimer:Cryptocurrency price analysis is highly speculative and volatile and should not be considered financial advice. Past and current performance is not indicative of future results. Always do your own research and consult with a financial advisor before making investment decisions.
- SEO Powered Content & PR Distribution. Get Amplified Today.
- Platoblockchain. Web3 Metaverse Intelligence. Knowledge Amplified. Access Here.
- Source: https://investorbites.com/ethereum-price-analysis-15-3/

