On-chain data shows the Ethereum Market Value to Realized Value (MVRV) ratio has entered inside a danger zone that has historically led to tops.
Ethereum MVRV Ratio Has Surged Into The Danger Zone Recently
In its latest insight post, the on-chain analytics firm Santiment has talked about some underlying metrics related to ETH. First, the firm has pointed out how the trading volume of the cryptocurrency has gone down since Ethereum’s surge from a few days back.

The value of the metric has been sharply going down recently | Source: Santiment
The trading volume observing a significant decline while the price is trying to continue its rally could indicate that momentum is weakening for the cryptocurrency.
One positive for the asset, though, could be the fact that the supply on exchanges has gone down since the rally started, implying that the investors have made net withdrawals.

Looks like the metric has plunged | Source: Santiment
Generally, investors transfer their Ethereum out of these central entities to hold onto it in self-custodial wallets for extended periods, so this decline in the supply on exchanges could be a sign of fresh accumulation.
Following the latest rise in the asset, its social dominance has also seen a jump. The “social dominance” here refers to the mindshare that Ethereum occupies on social media platforms among the top 100 cryptocurrencies by market cap.
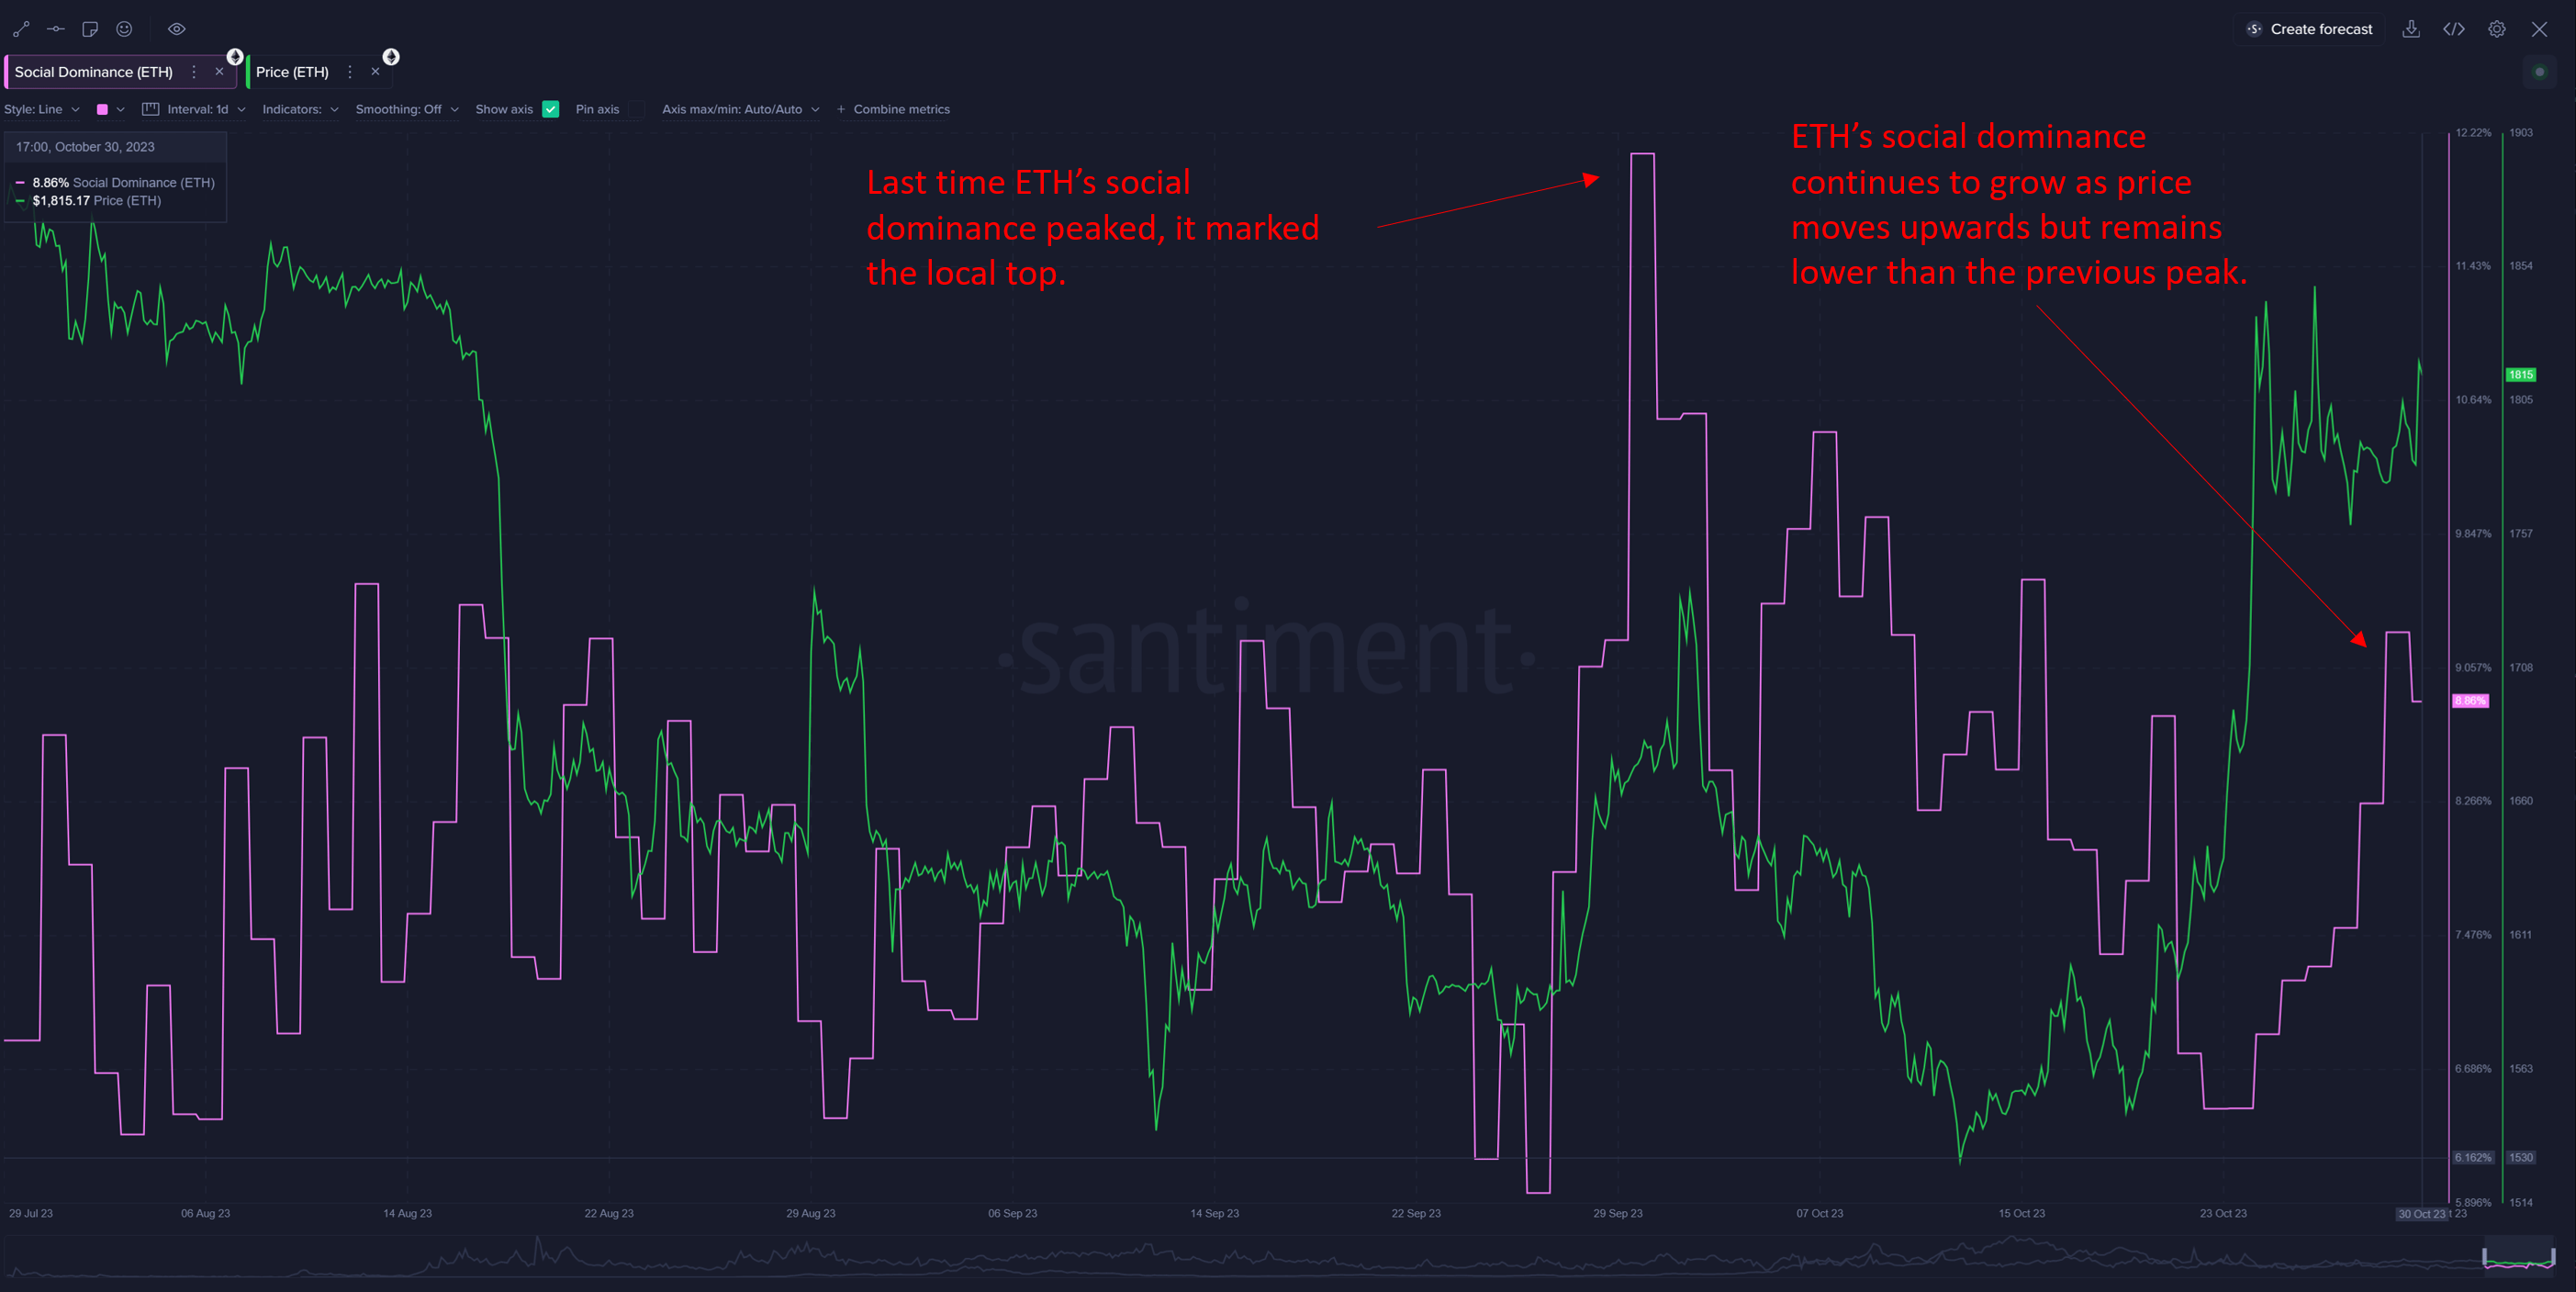
Interest around ETH has grown in the last few days | Source: Santiment
It would appear that more eyes have been turning at Ethereum recently, which can be a sign that hype is building up among the traders. Historically, too much hype has been negative for the asset, as it has often led to top formations.
So far, though, the social dominance is still notably below the levels it was at when ETH hit its local top at the start of this month, as is apparent in the above chart. According to Santiment, this “may suggest there can be some room for it to go before things cool down.”
A signal that is more concretely bearish for Ethereum, however, is the 30-day MVRV ratio. In simple terms, what this ratio tells us is how the value that investors are holding (the market cap) compares against the capital that they invested into the asset (the realized cap).
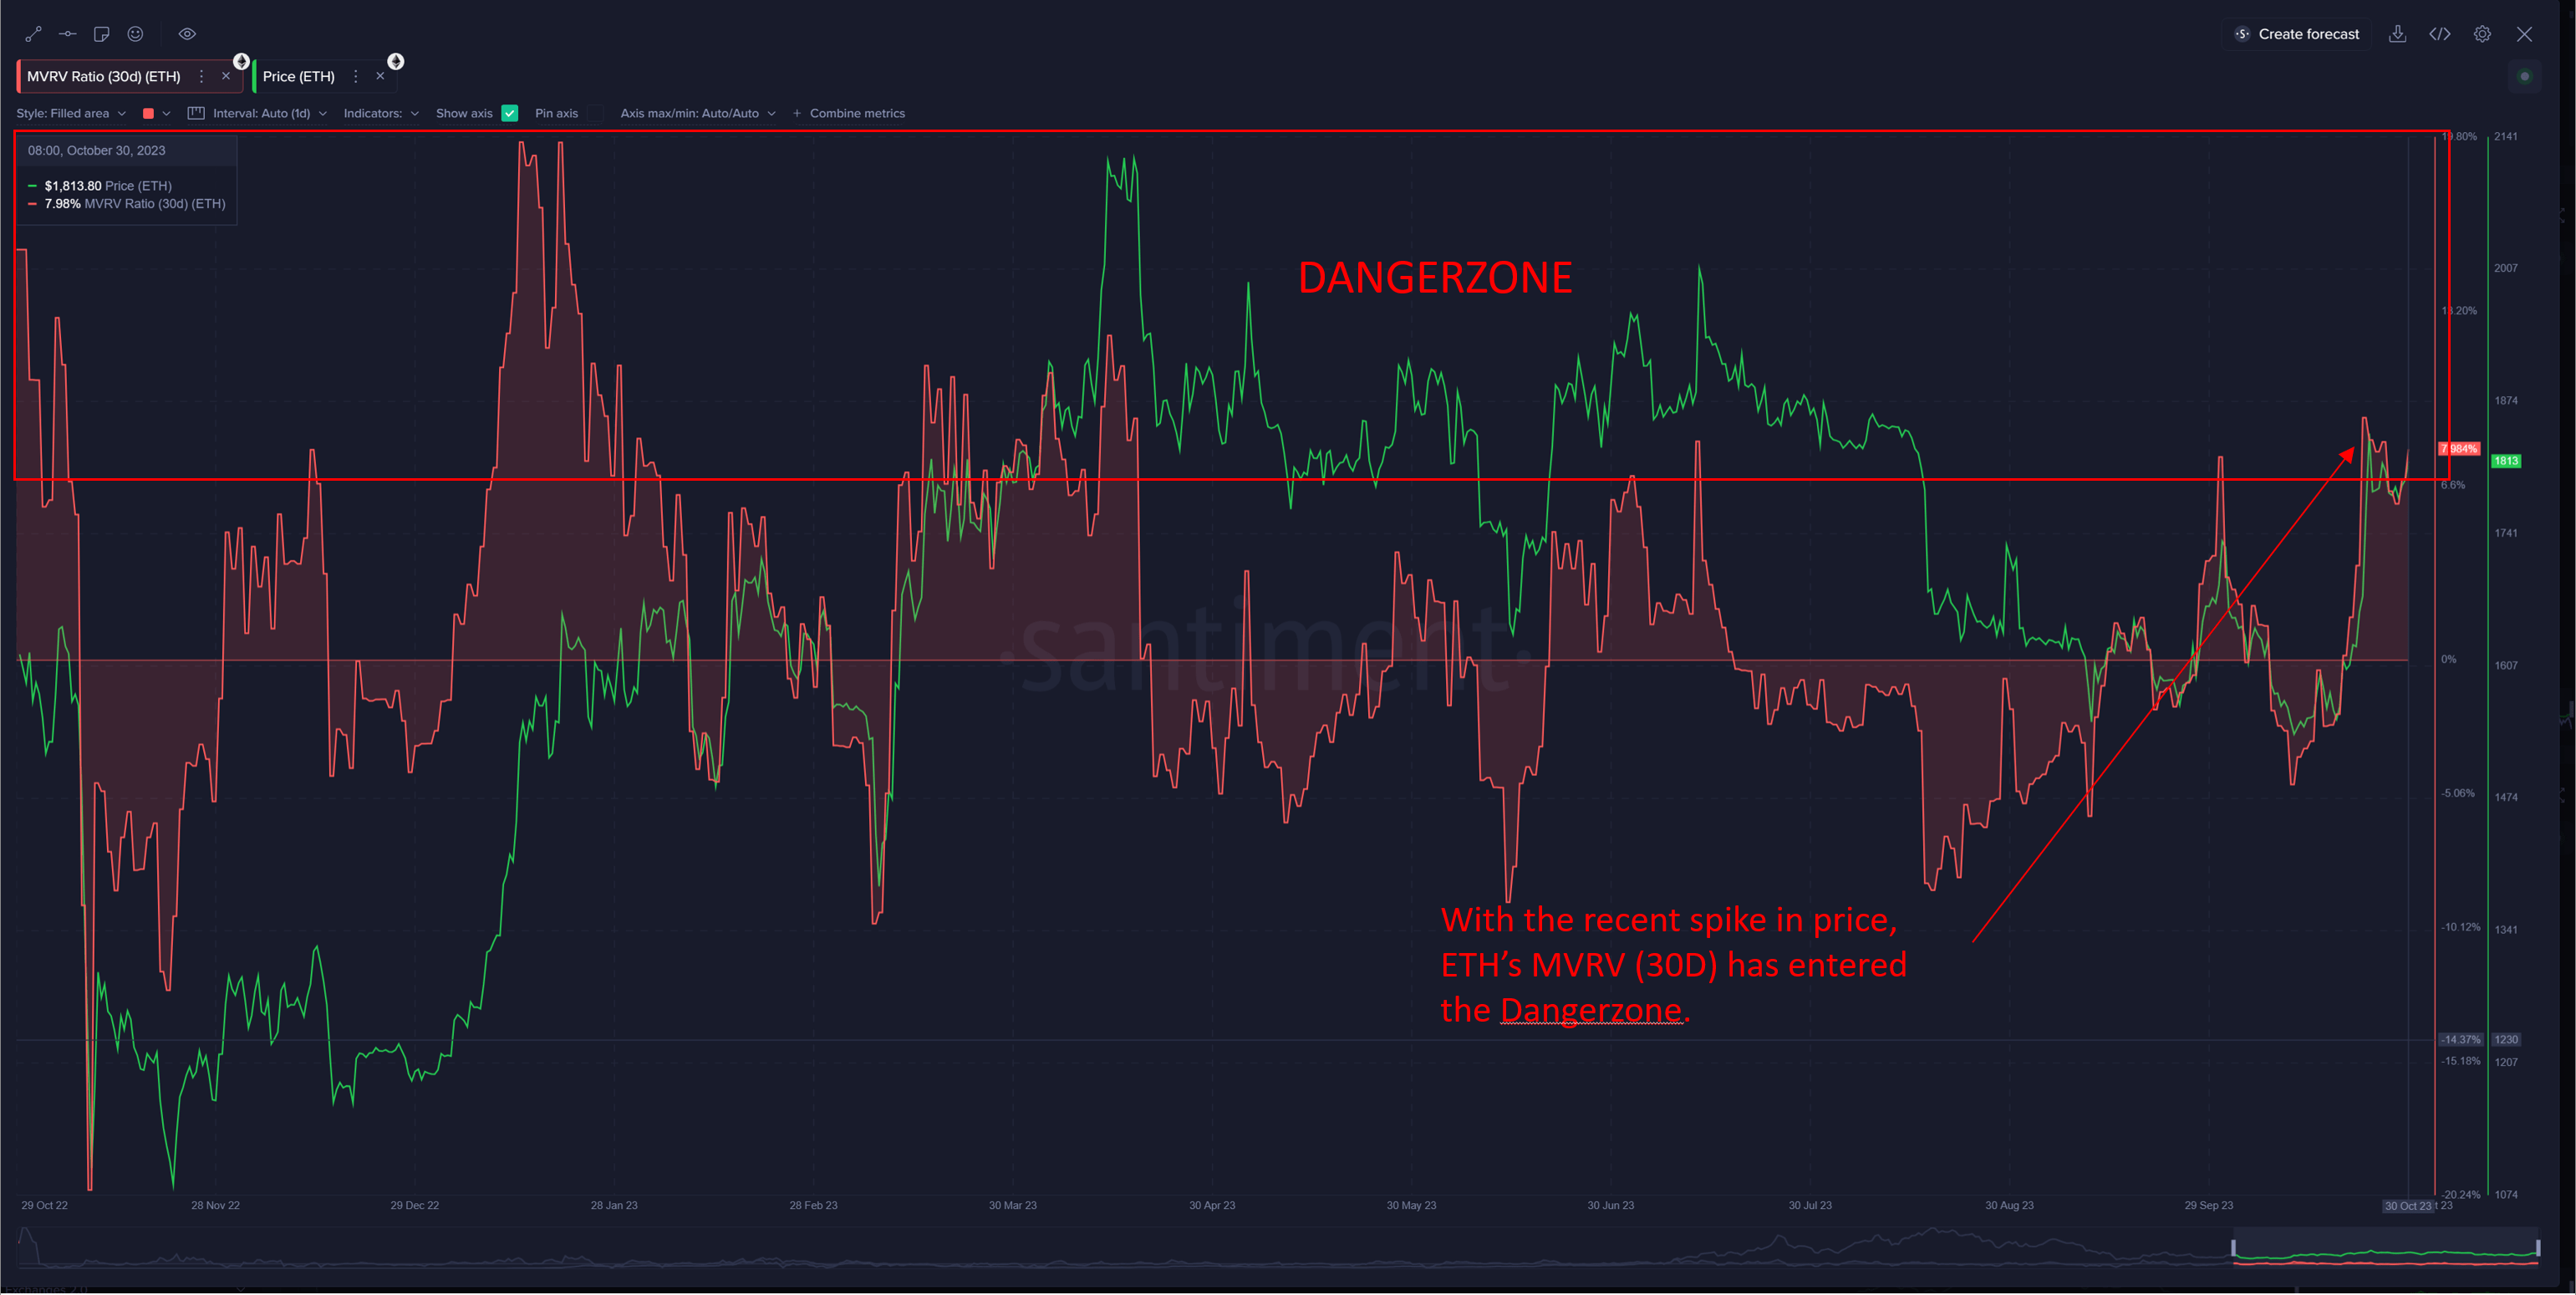
The indicator appears to have entered the danger zone | Source: Santiment
Here, Santiment has used the 30-day MVRV ratio, which means this indicator only keeps track of the investors/addresses who bought their coins within the last 30 days.
As shown in the chart, this Ethereum indicator has recently risen into a territory that the analytics firm labels as a “danger zone.” Historically, the price has seen a correction not too long after the metric has reached this zone so another local top may be due for Ethereum right now.
ETH Price
At the time of writing, Ethereum is trading at around $1,800, up 1% in the past week.
ETH has been stuck in consolidation recently | Source: ETHUSD on TradingView
Featured image from Kanchanara on Unsplash.com, charts from TradingView.com, Santiment.net
- SEO Powered Content & PR Distribution. Get Amplified Today.
- PlatoData.Network Vertical Generative Ai. Empower Yourself. Access Here.
- PlatoAiStream. Web3 Intelligence. Knowledge Amplified. Access Here.
- PlatoESG. Carbon, CleanTech, Energy, Environment, Solar, Waste Management. Access Here.
- PlatoHealth. Biotech and Clinical Trials Intelligence. Access Here.
- Source: https://www.newsbtc.com/news/ethereum/ethereum-bearish-mvrv-entered-danger-zone/

