After a retracement from its current high of $0.22960, the price of Dogecoin (DOGE) looks like it is not yet done as the memecoin bounced back and moving toward its current high.
Dogecoin Price Technical Analysis
Dogecoin is one of the few memecoins that have captured the hearts of many crypto investors. Like Shiba Inu and Pepecoin (PEPE), Dogecoin is backed up by a strong and exciting community which has played a huge role in its success so far.
At the time of writing, the price of DOGE was trading around $0.19713 and was up by over 5% in the last 24 hours. Also, the price is currently trading above the 100-day moving average with very strong bullish momentum in the 4-hour timeframe.
The MACD indicator in the 4-hour timeframe suggests an upward spike. This is so because the MACD line and the MACD signal that was trending below the zero line have both crossed, heading toward the MACD zero line.
If the MACD line and the MACD signal line manage to cross above the MACD zero, Dogecoin might move higher to create a new high. Meanwhile, the MACD histogram is already trending above the zero line which suggests a bullish momentum.
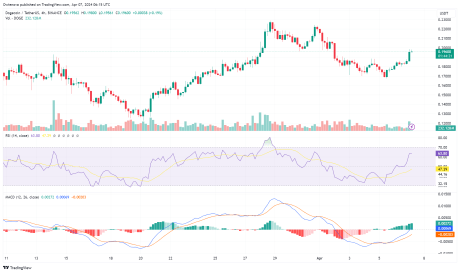
The Relative Strength Index (RSI) on the 4-hour timeframe also indicates a bullish momentum toward the upward direction as the RSI signal line has crossed above the 50% level and is heading towards the overbought zone. According to the RSI indicator, the strength of the upward movement is still very strong as buyers are still very active in the market.
Potential Retracement On The Downside
Given the price’s previous surge, two major resistance levels and one major support level were created around $0.22960, $0.2244, and $0.19622 respectively. If the price of DOGE manages to move above the resistance level of $0.22441 level, it might move even further upward toward the resistance level of $0.22960.
At this point, if the price succeeds in breaking above this level, the price might surge higher to create a new high. On the other hand, if the price fails to break above this resistance level, the price might start a new downward movement toward its previous support level of $0.19622. However, a breakout below the $0.19622 level could trigger a new downward trend.
Featured image from iStock, chart from Tradingview.com
Disclaimer: The article is provided for educational purposes only. It does not represent the opinions of NewsBTC on whether to buy, sell or hold any investments and naturally investing carries risks. You are advised to conduct your own research before making any investment decisions. Use information provided on this website entirely at your own risk.
- SEO Powered Content & PR Distribution. Get Amplified Today.
- PlatoData.Network Vertical Generative Ai. Empower Yourself. Access Here.
- PlatoAiStream. Web3 Intelligence. Knowledge Amplified. Access Here.
- PlatoESG. Carbon, CleanTech, Energy, Environment, Solar, Waste Management. Access Here.
- PlatoHealth. Biotech and Clinical Trials Intelligence. Access Here.
- Source: https://www.newsbtc.com/dogecoin-2/dogecoin-rally-intensifies-eyes-set-on-historic-new-highs/

