In a recent analysis shared by renowned crypto analyst, Jaydee, Dogecoin (DOGE) appears to be setting the stage for a potentially significant price rally. The chart showcases a series of technical indicators and patterns that hint towards a bullish trajectory for the meme coin, with a projected price target above $1.5.
In a tweet accompanying the chart, Jaydee remarked: “Dogecoin – meme (shitcoin) with a beautiful chart structure! Will DOGE have that confirmed breakout?! Last time it broke out from a multi-year triangle, it 380x in price! Similar structure compared to the 2020-2021 breakout!”
Dogecoin Price Prints Historic Buy Signal
The chart provided by Jaydee displays the DOGE/USD trading pair with a bi-weekly time frame. Dogecoin’s price history, as highlighted in the chart, reveals two significant breakout points.
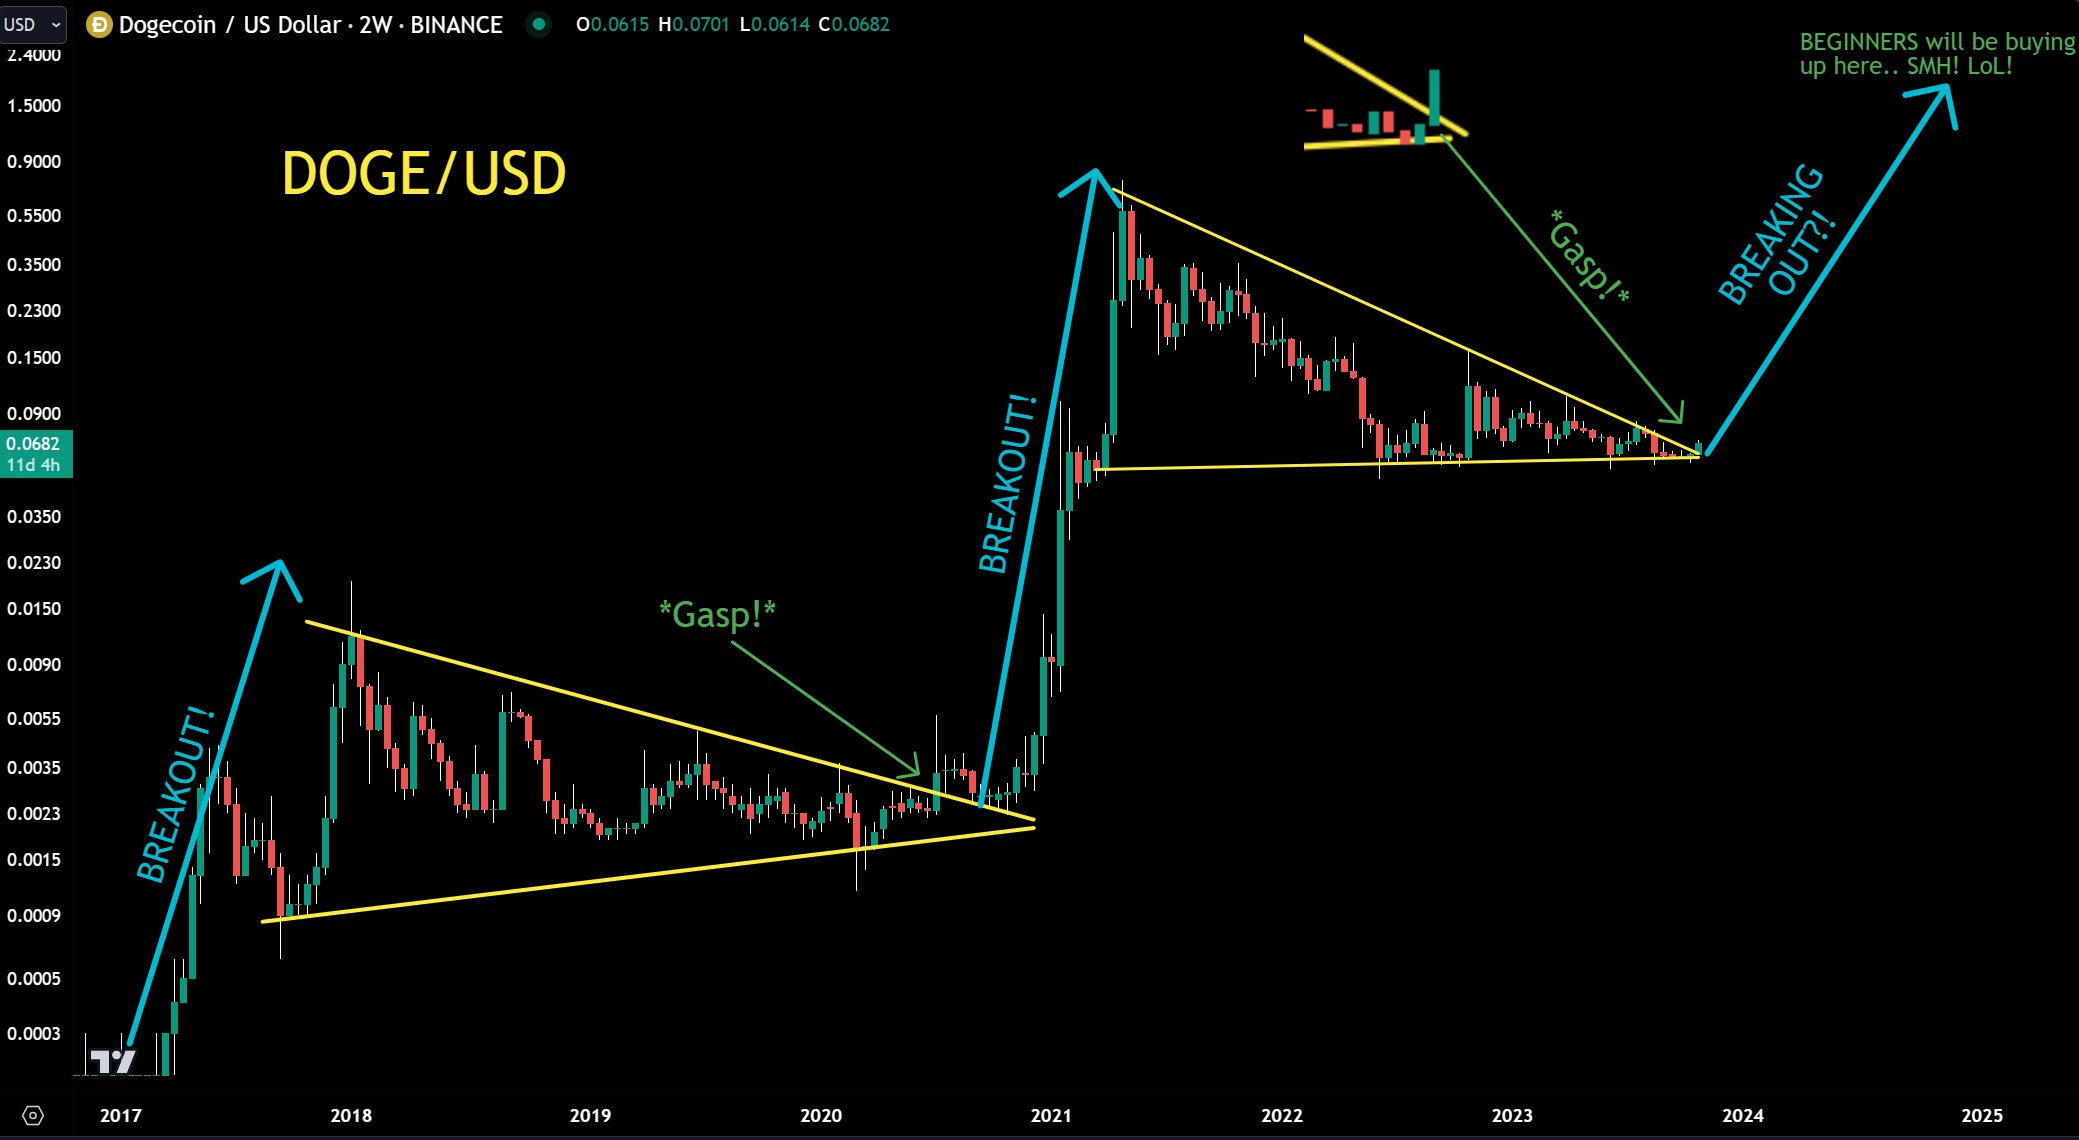
The first breakout took place in 2017, where the price surged from below $0.003 in March 2017 to a peak of $0.0193 in January 2018. The second notable breakout occurred around the end of 2020 till April 2021, skyrocketing the DOGE price from about $0.035 to an all-time high close to $0.76.
Over the past few two years, from April 2021 till recently, Dogecoin’s price has been forming a symmetrical triangle pattern again. This is a classic continuation pattern, and given DOGE’s past bullish momentum, a breakout from this triangle to the upside seems plausible.
Remarkably, DOGE’s 380x price rise was also preceded by a multi-year triangular formation. At the end of 2020, DOGE broke out of the formation, but first experienced a successful retest of the trendline and a short sideways phase of around three months before the massive rally.
Jaydee’s analysis indicates that the DOGE price has begun its breakout from this symmetrical triangle with this week’s candle, hinting at a continuation of its previous bullish trend. If history repeats itself, DOGE could first experience another minor pullback, followed by a short sideways phase, before the ascent towards the current all-time high begins.
By extrapolating from past performance and the present chart structure, Jaydee’s analysis proposes that a confirmed breakout could see DOGE aiming for the $1.5 price range sometime in 2024, as detailed with the blue arrow in the chart.
The chart humorously remarks that “BEGINNERS will be buying up here.. SMH! LOL!”, suggesting that novice traders might be lured into buying at the peak. While it’s a lighthearted note, it’s also a cautionary tale for traders to conduct their due diligence and not follow the herd mentality.
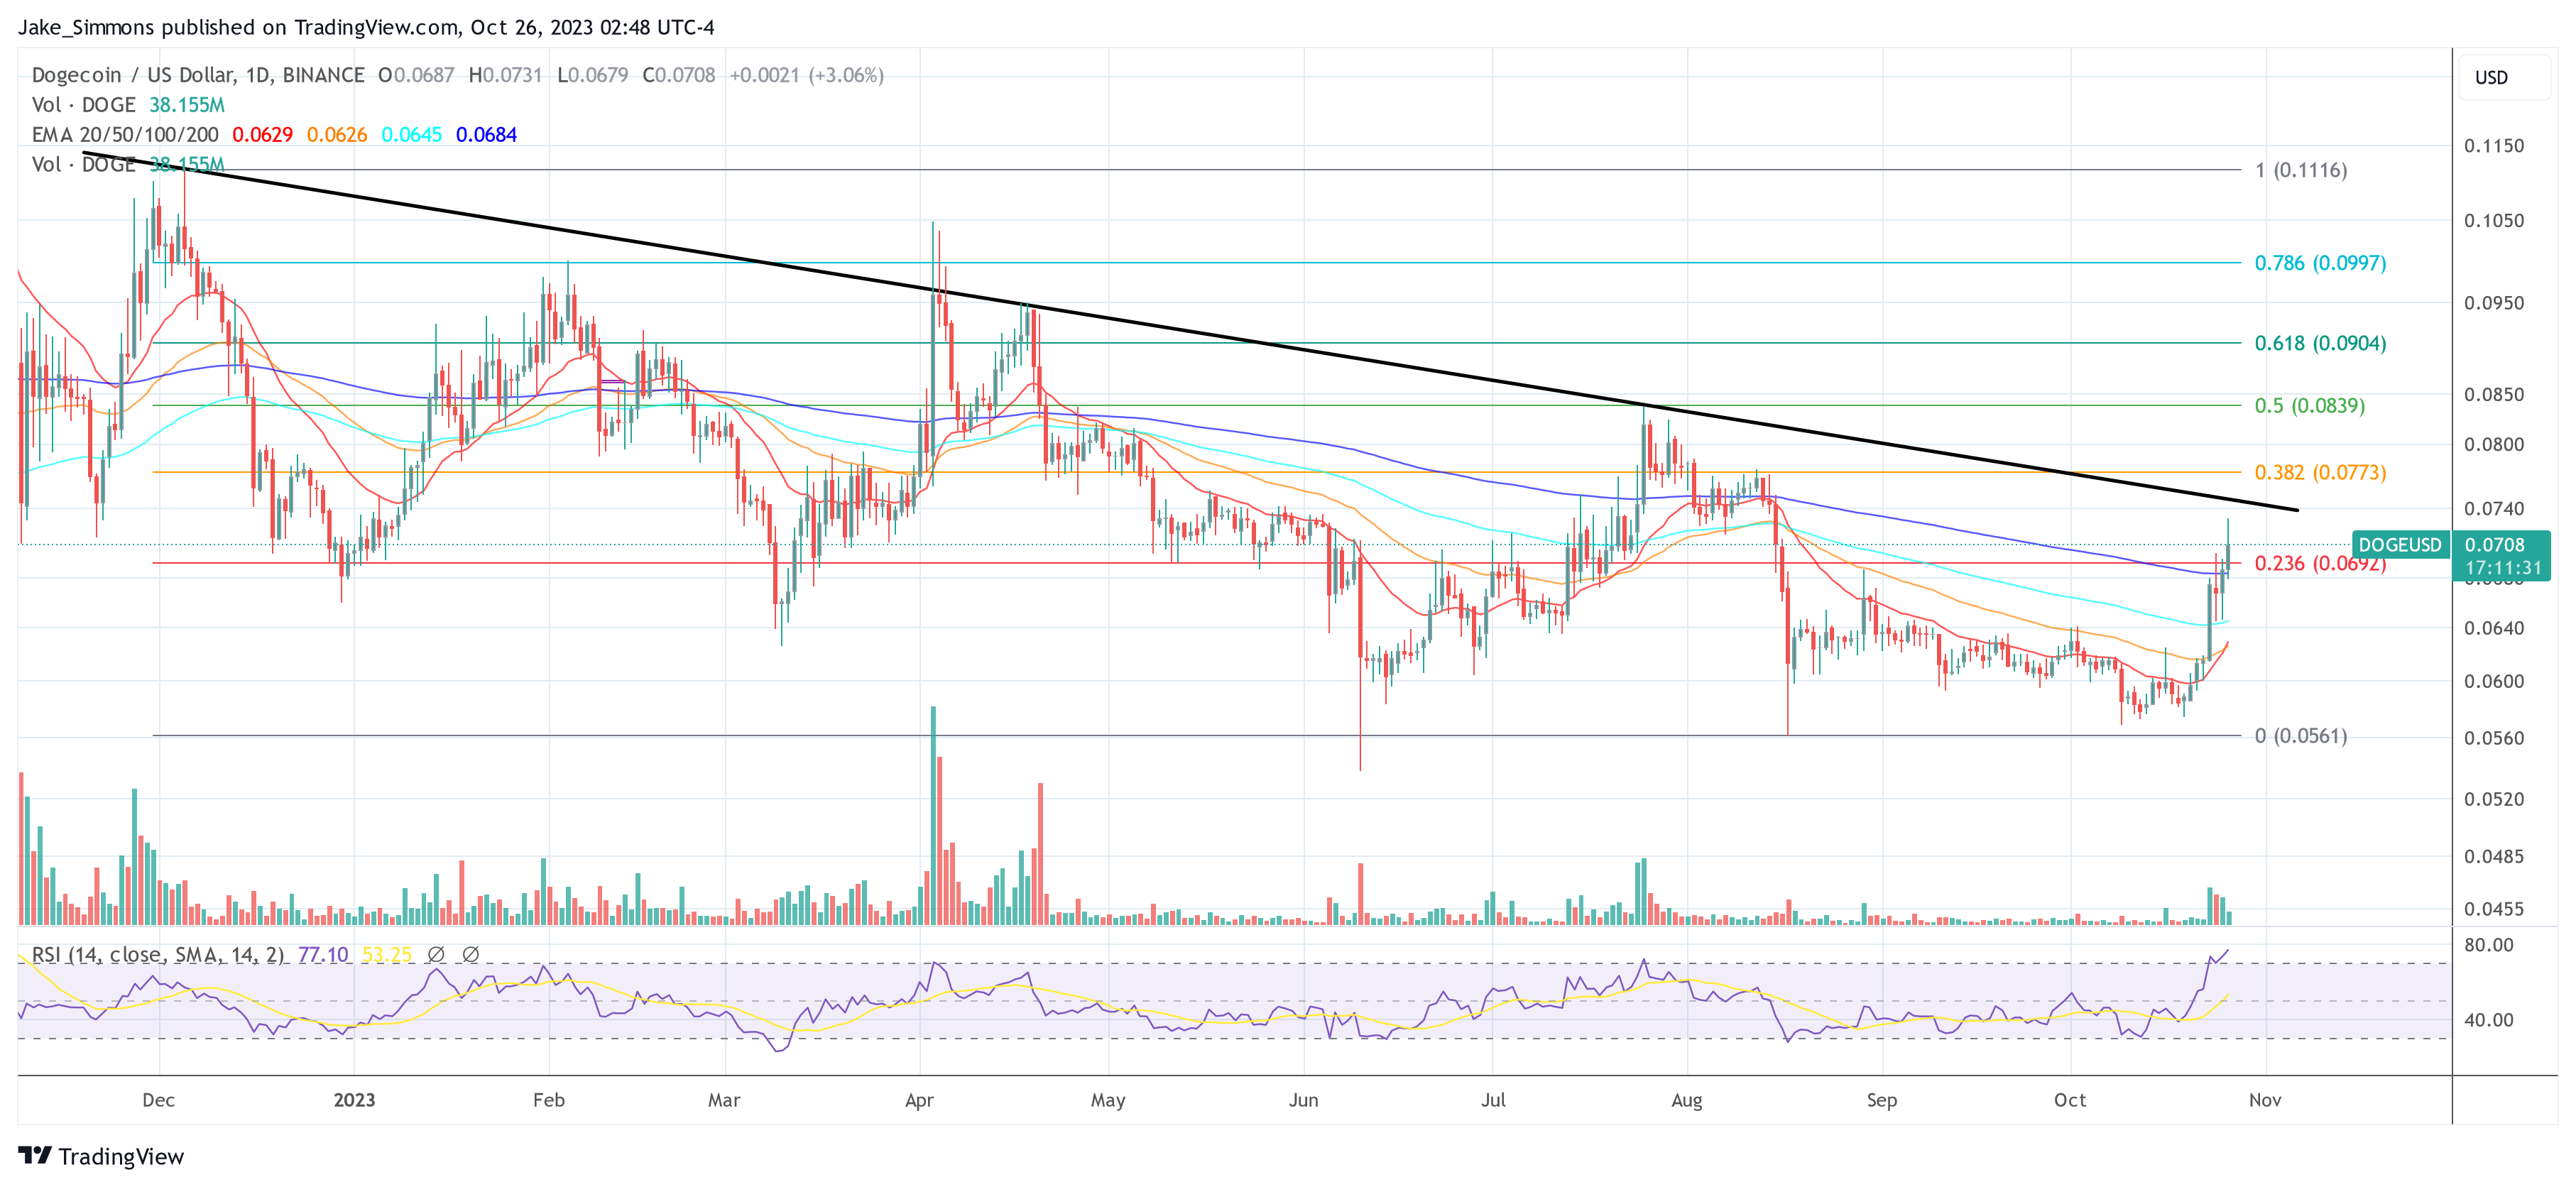
While the 2-week chart in Jaydee’s analysis has already posted a bullish breakout signal, the 1-day chart still looks somewhat different. The price is still below the trendline (black), at which Dogecoin has been rejected several times since December last year. However, DOGE has crossed the 0.236 Fibonacci retracement level at $0.0692 and is now approaching the trendline again.
Featured image from Shutterstock, chart from TradingView.com
- SEO Powered Content & PR Distribution. Get Amplified Today.
- PlatoData.Network Vertical Generative Ai. Empower Yourself. Access Here.
- PlatoAiStream. Web3 Intelligence. Knowledge Amplified. Access Here.
- PlatoESG. Carbon, CleanTech, Energy, Environment, Solar, Waste Management. Access Here.
- PlatoHealth. Biotech and Clinical Trials Intelligence. Access Here.
- Source: https://www.newsbtc.com/news/dogecoin/dogecoin-price-poised-epic-surge-1-5-crypto-analyst/

