Chainlink (LINK) is in the green today, building on its current price form, as it seeks to break higher resistance levels. Its price performance in 2023 has been impressive, from $5.6224 on January 1, 2023, to its current price of $8.68. Despite price volatility, LINK has reclaimed the $8 price level and is currently in an uptrend.
Chainlink Sustains Its Uptrend As It Consolidates Above $8
LINK spiked from $7.7524 on April 14 to $8.1033 on April 15. It has remained above $8 for the last three days recording new highs on the price chart.
Also, its trading volume has spiked by over 28% within 24 hours, which could be the reason behind its current price surge. LINK has recorded a 5.87% price increase within 24 hours, which could signal the continuation of its rally.
It is trading above its 7-day high of $8.4753, sparking a bullish revival as it seeks to continue its ascent. Recent developmental activities on its network, such as the increase in smart contract use cases, contribute positively to its price action.
Also, the upcoming Hackathon Spring 2023, a community-based event, generates positive publicity for the asset. Such activities and other fruitful partnerships have transformed LINK into a hub of developmental activity. The increased on-chain activity is also one of the factors lending support to the current price trend.
Will We See Further Increase Above $9?
Chainlink is trading in an uptrend forming a long green candle on the daily chart today. It has posted its sixth consecutive green day, confirming the prevalent bullish trend in the market.
LINK is above its 50-day and 200-day Simple Moving Averages (SMA), a bullish sentiment for the short and long term. It implies that the bulls are still in control and will keep pushing the price. It is trading in the upper region of the Donchian channel, which also confirms the bullish trend.
The Relative Strength Index (RSI) is at 71.78 in the overbought region. This zone reflects the increase in trading volume and shows that traders are taking long positions in the market. Notably, the RSI is still moving upwards, indicating rising buyers’ interest in the market.
LINK Support And Resistance Levels
LINK’s support levels are $5.9 and $6.75, and resistance levels are $7.735 and $8.397. It is above its first two resistance levels, signaling a further price increase.
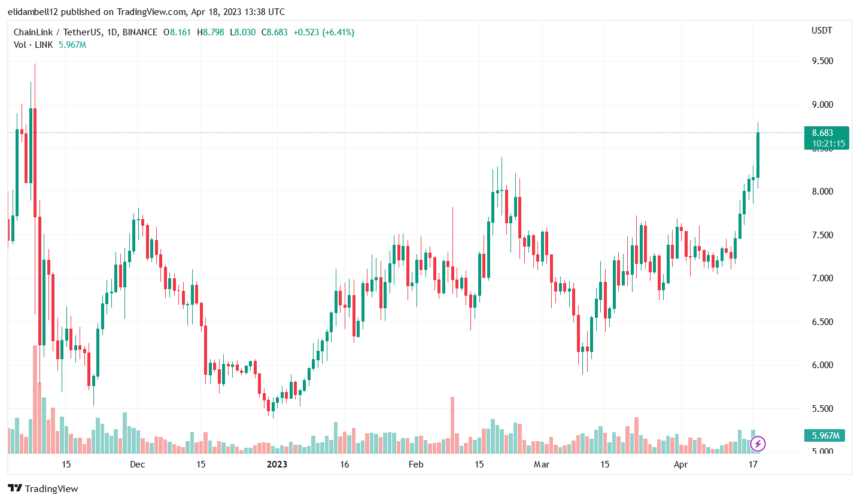
If the bulls persist, the asset will likely test the $9.48 resistance level in the coming days. However, it might decline briefly to consolidate its gains before it resumes its uptrend. LINK’s rally is impressive as it builds on its gains, following large-cap cryptocurrencies like Bitcoin.
Featured image from Pixabay and chart from Tradingview
- SEO Powered Content & PR Distribution. Get Amplified Today.
- Platoblockchain. Web3 Metaverse Intelligence. Knowledge Amplified. Access Here.
- Minting the Future w Adryenn Ashley. Access Here.
- Source: https://www.newsbtc.com/analysis/link/chainlink-continues-to-rise-will-it-surge-over-the-9-boundary/

