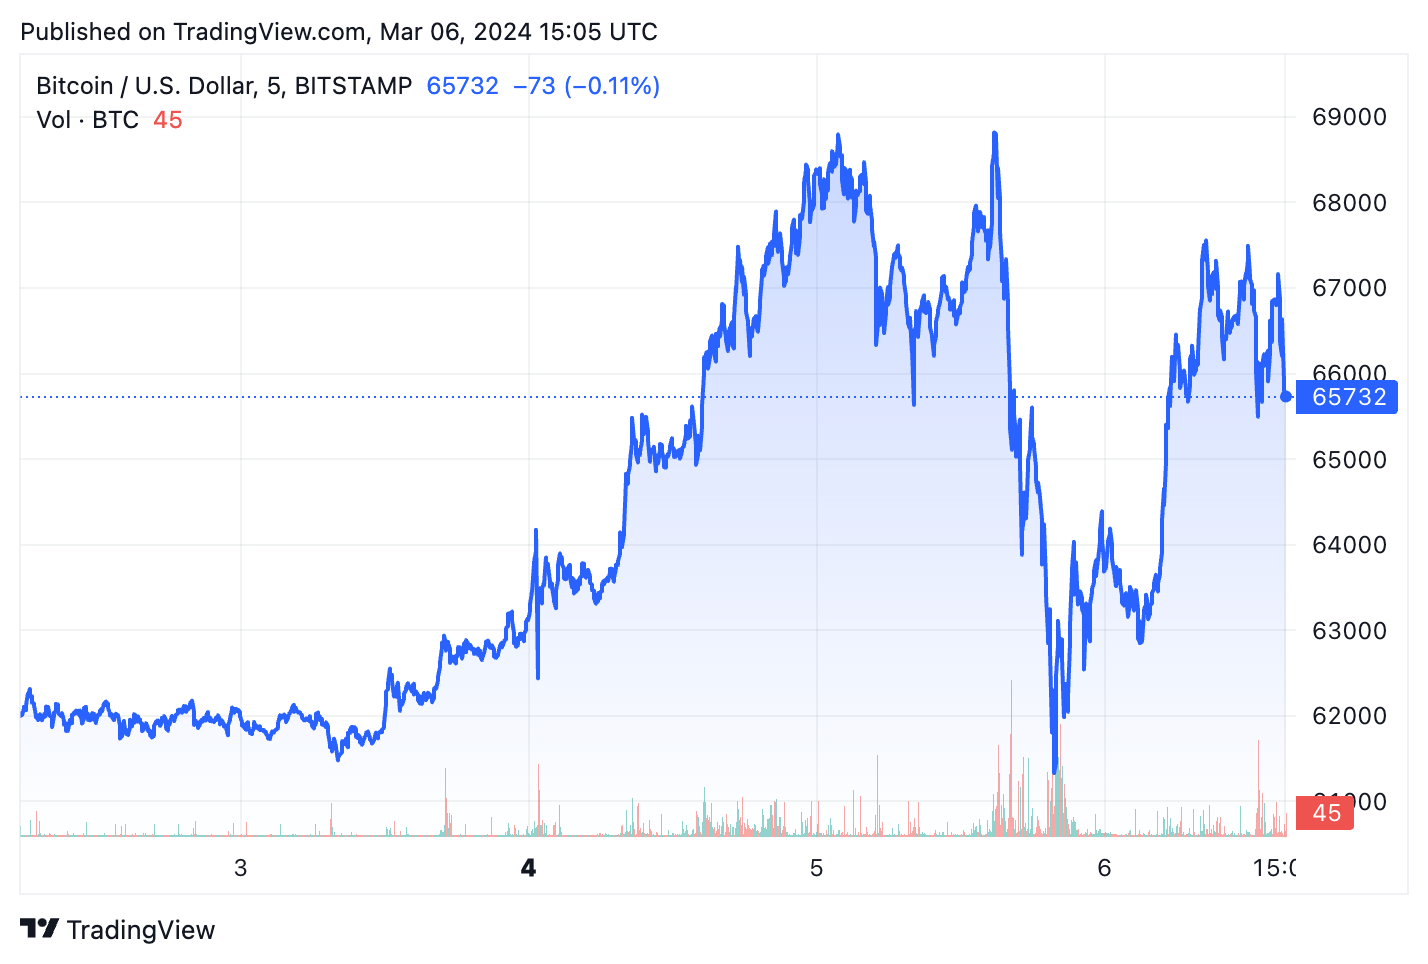
On Mar. 5, Bitcoin reached the all-time high it posted in November 2021, breaking through $69,000 in the late afternoon UTC. However, Bitcoin’s stint at its ATH was extremely brief and was quickly followed by a sharp 14% correction that pushed its price down to $59,300. In the early morning of Mar. 6, BTC regained some of its lost footing but struggled to stabilize at $66,000.
The market’s intense price volatility on Tuesday, Mar. 5, translated to record-breaking trading volumes across centralized exchanges. With little data on the volume seen on OTC desks and a lag in data availability from spot ETFs, CEX volume serves as the best barometer for market activity when it comes to Bitcoin.
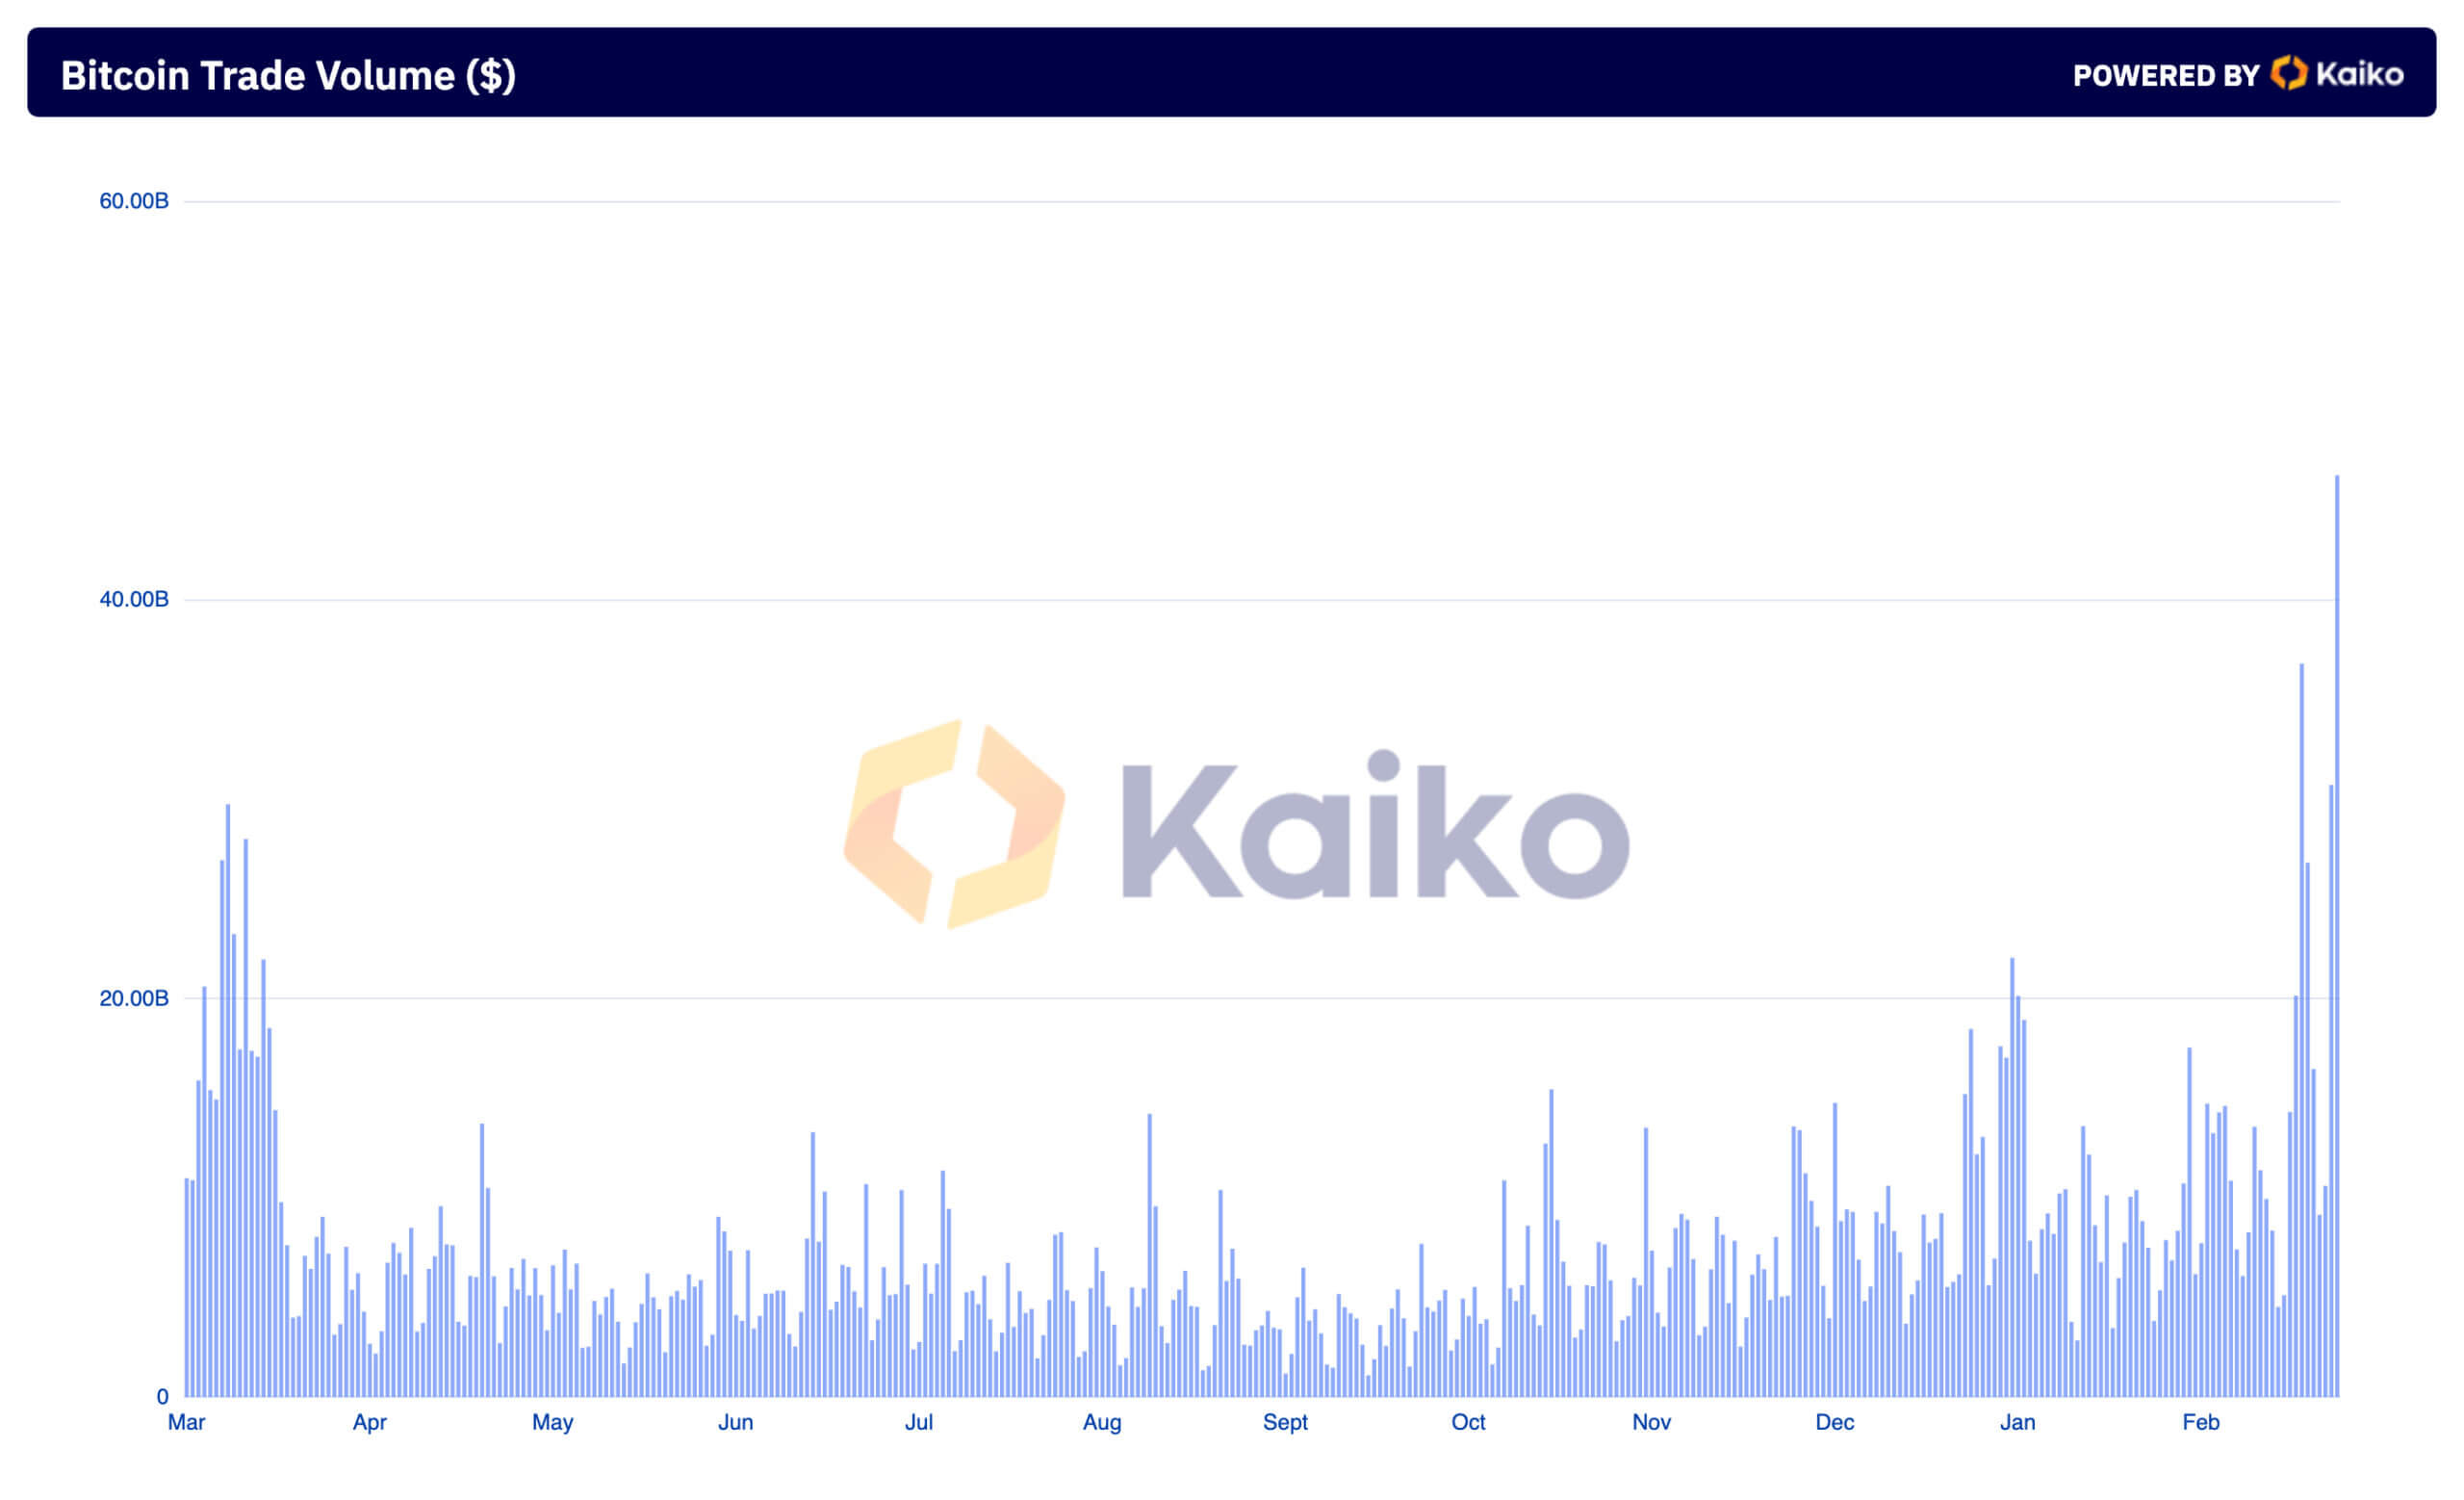
The analysis of Kaiko data by CryptoSlate revealed a 405% increase in trading volume in trading volume between Mar. 2 and Mar. 5 — rising from $9.15 billion to $46.25 billion. This surge followed Bitcoin’s volatile price action, showing an aggressive reaction from traders to price fluctuations.
The increase in trading volume was mirrored by a growth in trade count, which escalated from 10.12 million to 32.79 million over the same period. This shows increased engagement in the market and possibly a higher influx of retail and institutional investors.
The changes seen in the average trade size further corroborate this. Between Mar. 2 and Mar. 5, the average trade size increased by over 55%, jumping from $904 to $1,410, showing larger capital movements within the market as traders rushed to capitalize on the price volatility.
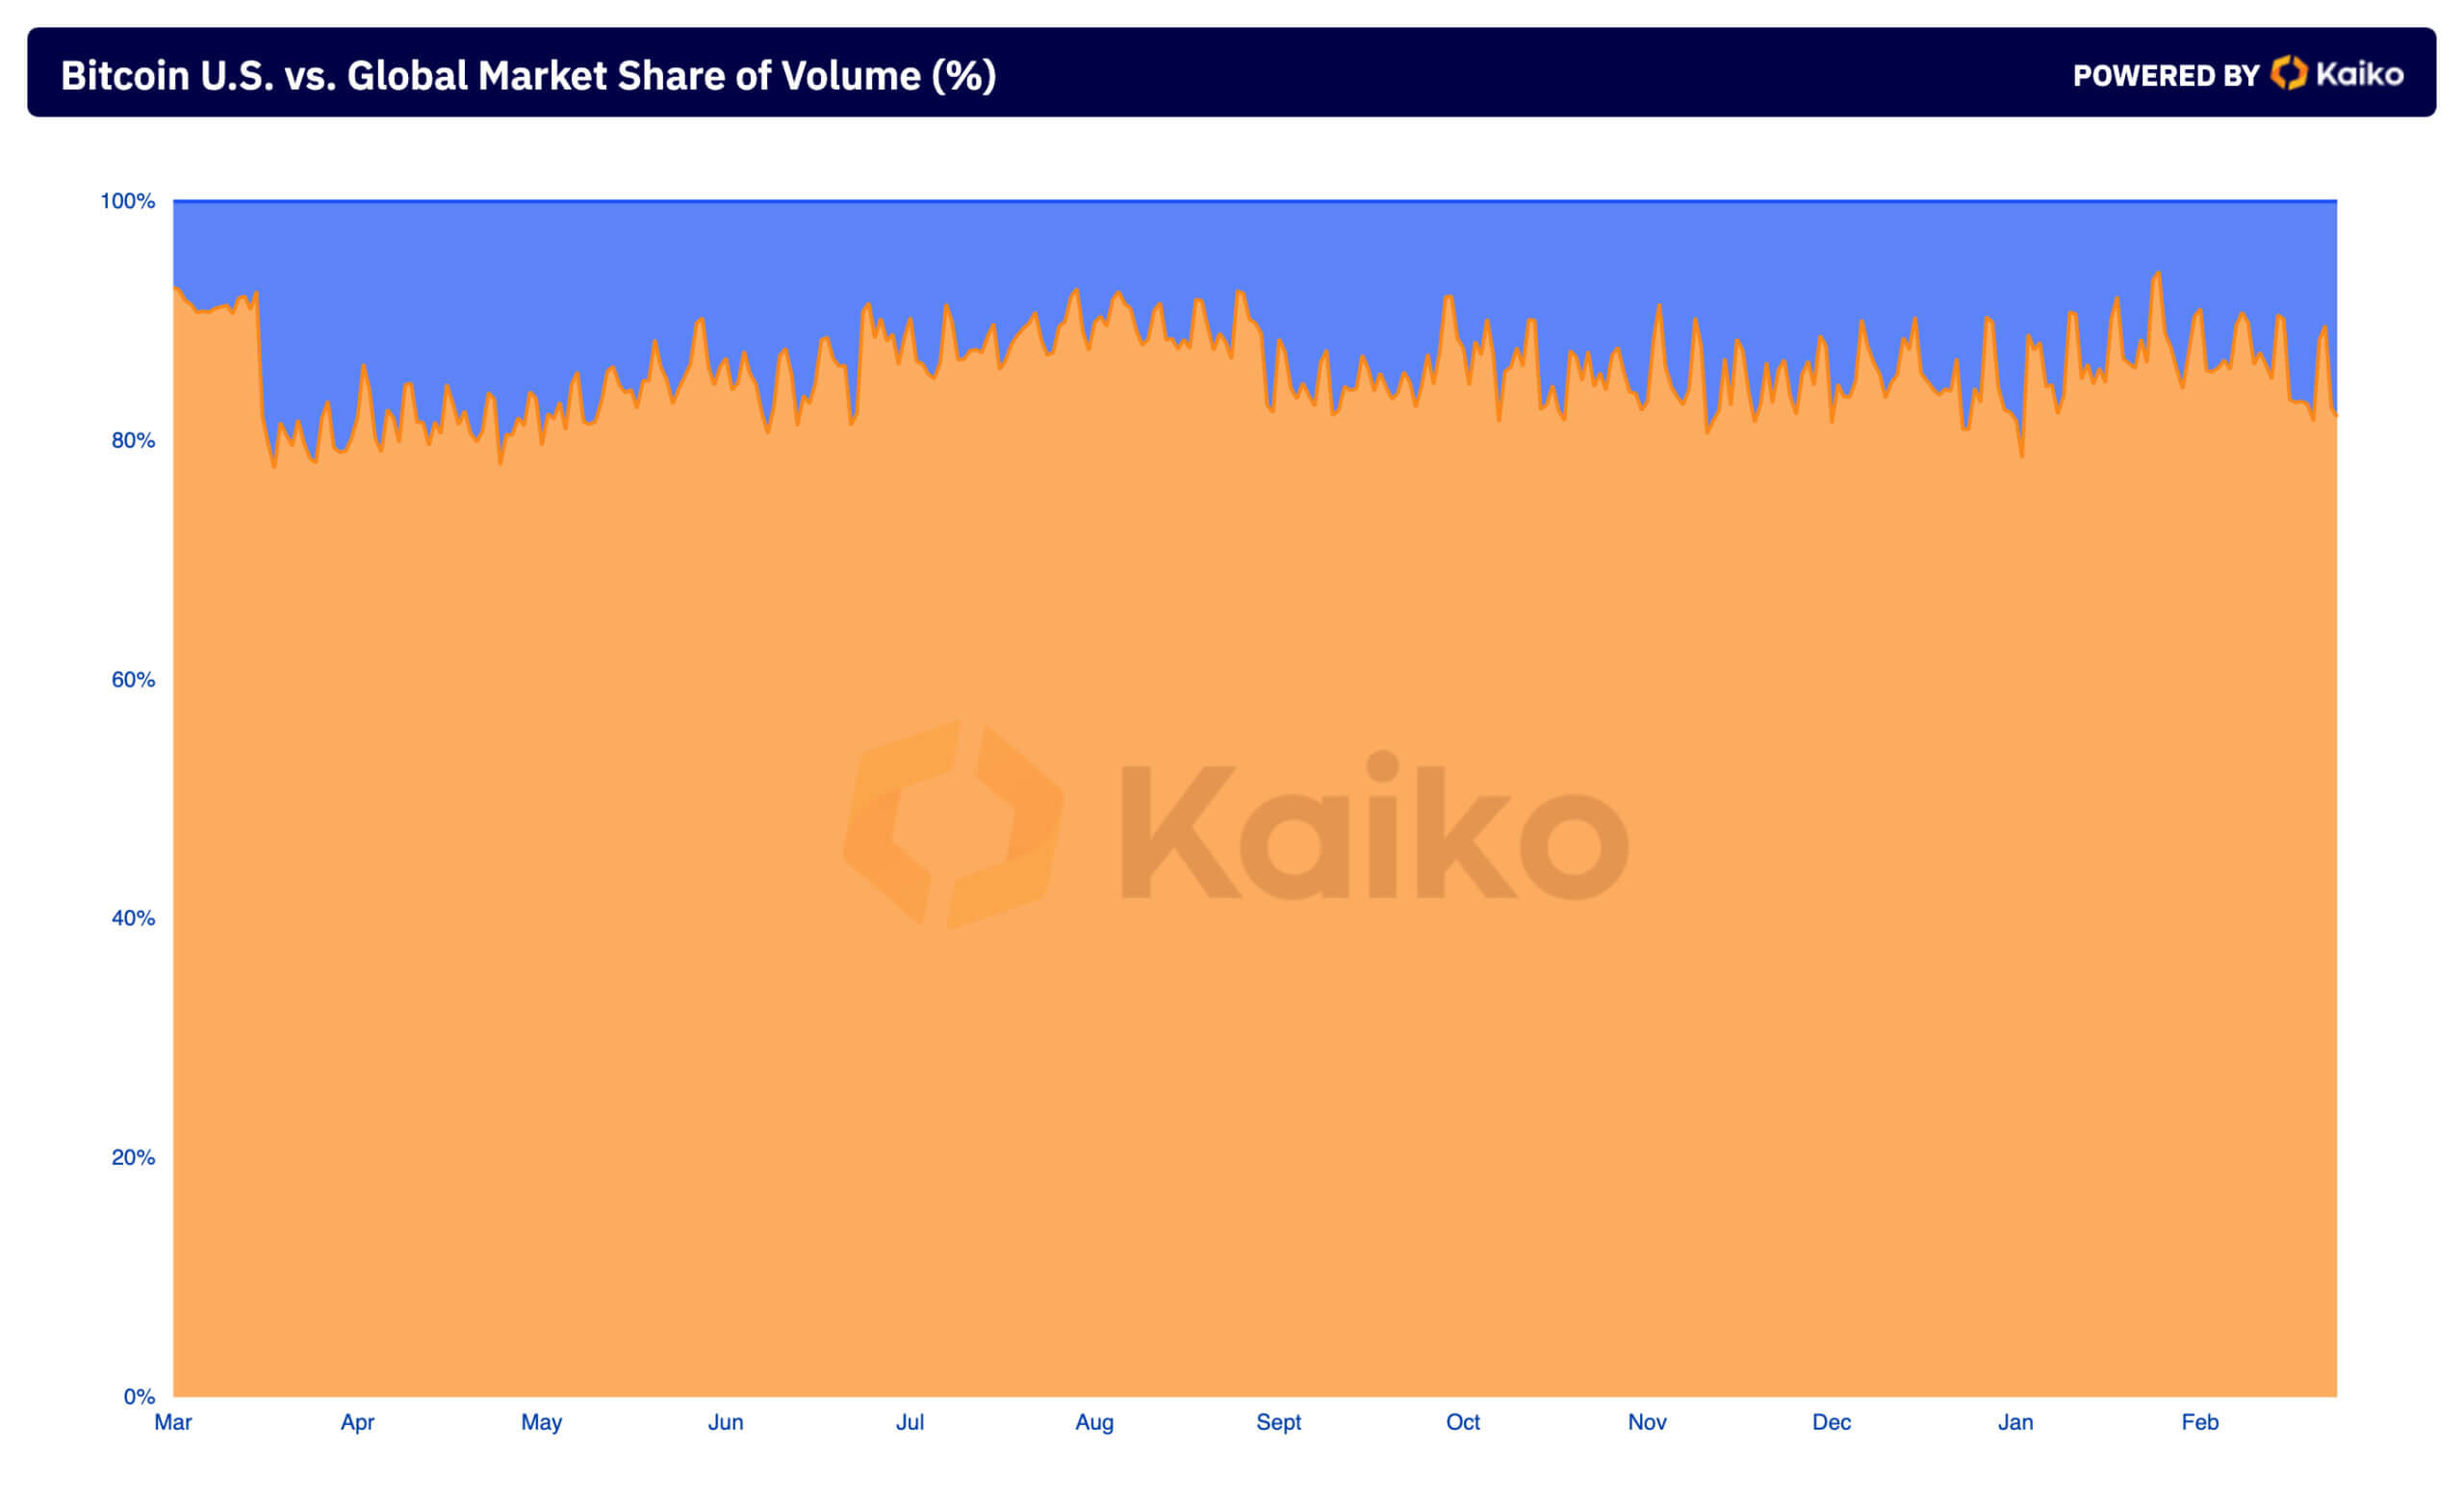
Analyzing the distribution of trading volume between US and global markets shows where most of this volume was coming from. The global market has consistently dominated Bitcoin trading volume, as previously covered by CryptoSlate. However, the US market’s share of the volume increased from 11.6% on Mar. 2 to 18.05% by Mar. 5, showing a significant increase in interest from US-based investors during this volatile period.
Keeping up with the long-term trend, Binance commanded a significant majority of the global trading volume with 51.54%, while Coinbase led the US exchange market with a 57.89% share. Binance and Coinbase’s dominance over the crypto market has been well-known for years, and the two exchanges consistently account for a substantial portion of global trading activity. The high concentration of trading on the two exchanges, particularly during this week’s high volatility, shows traders prefer to stick to platforms with high liquidity and a big name.
Coinbase’s recent issues with account balances impacted the number of trades executed through the platform, leading to a significant outflow of BTC from the exchange. However, the impact on the overall trading volume on the exchange seems to have been minimal, as evidenced by Coinbase’s dominance in the US market.
The intense price volatility experienced during the week attracted significant trading activity, drawing in both existing and new market participants. The surge in volume, trade count, and trade sizes shows traders were aggressively engaging with the market, responding to Bitcoin’s spike with larger trade sizes. This action shows centralized exchanges’ critical role in facilitating liquidity and providing price discovery, particularly during significant market movements.
- SEO Powered Content & PR Distribution. Get Amplified Today.
- PlatoData.Network Vertical Generative Ai. Empower Yourself. Access Here.
- PlatoAiStream. Web3 Intelligence. Knowledge Amplified. Access Here.
- PlatoESG. Carbon, CleanTech, Energy, Environment, Solar, Waste Management. Access Here.
- PlatoHealth. Biotech and Clinical Trials Intelligence. Access Here.
- Source: https://cryptoslate.com/cexs-saw-record-breaking-trading-volume-as-bitcoin-touched-ath/

