
Published 18 hours ago
BTC price prediction: The V-shaped recovery from $19650 support has prolonged its recovery as the market sentiment improves. Today, as the Bitcoin price jumped 6%, the daily candle provided a massive breakout from a long-coming resistance of $25200. Here’s how this breakout may influence the BTC’s further rally.
advertisement
Key Points
- The Bitcoin Fear and Greed Index at 51% mark indicates a neutral sentiment among market participants.
- The $25200 breakout sets BTC price on a 5.7% upswing
- The intraday trading volume in Bitcoin is $43.2 Billion, indicating a 9.5% gain
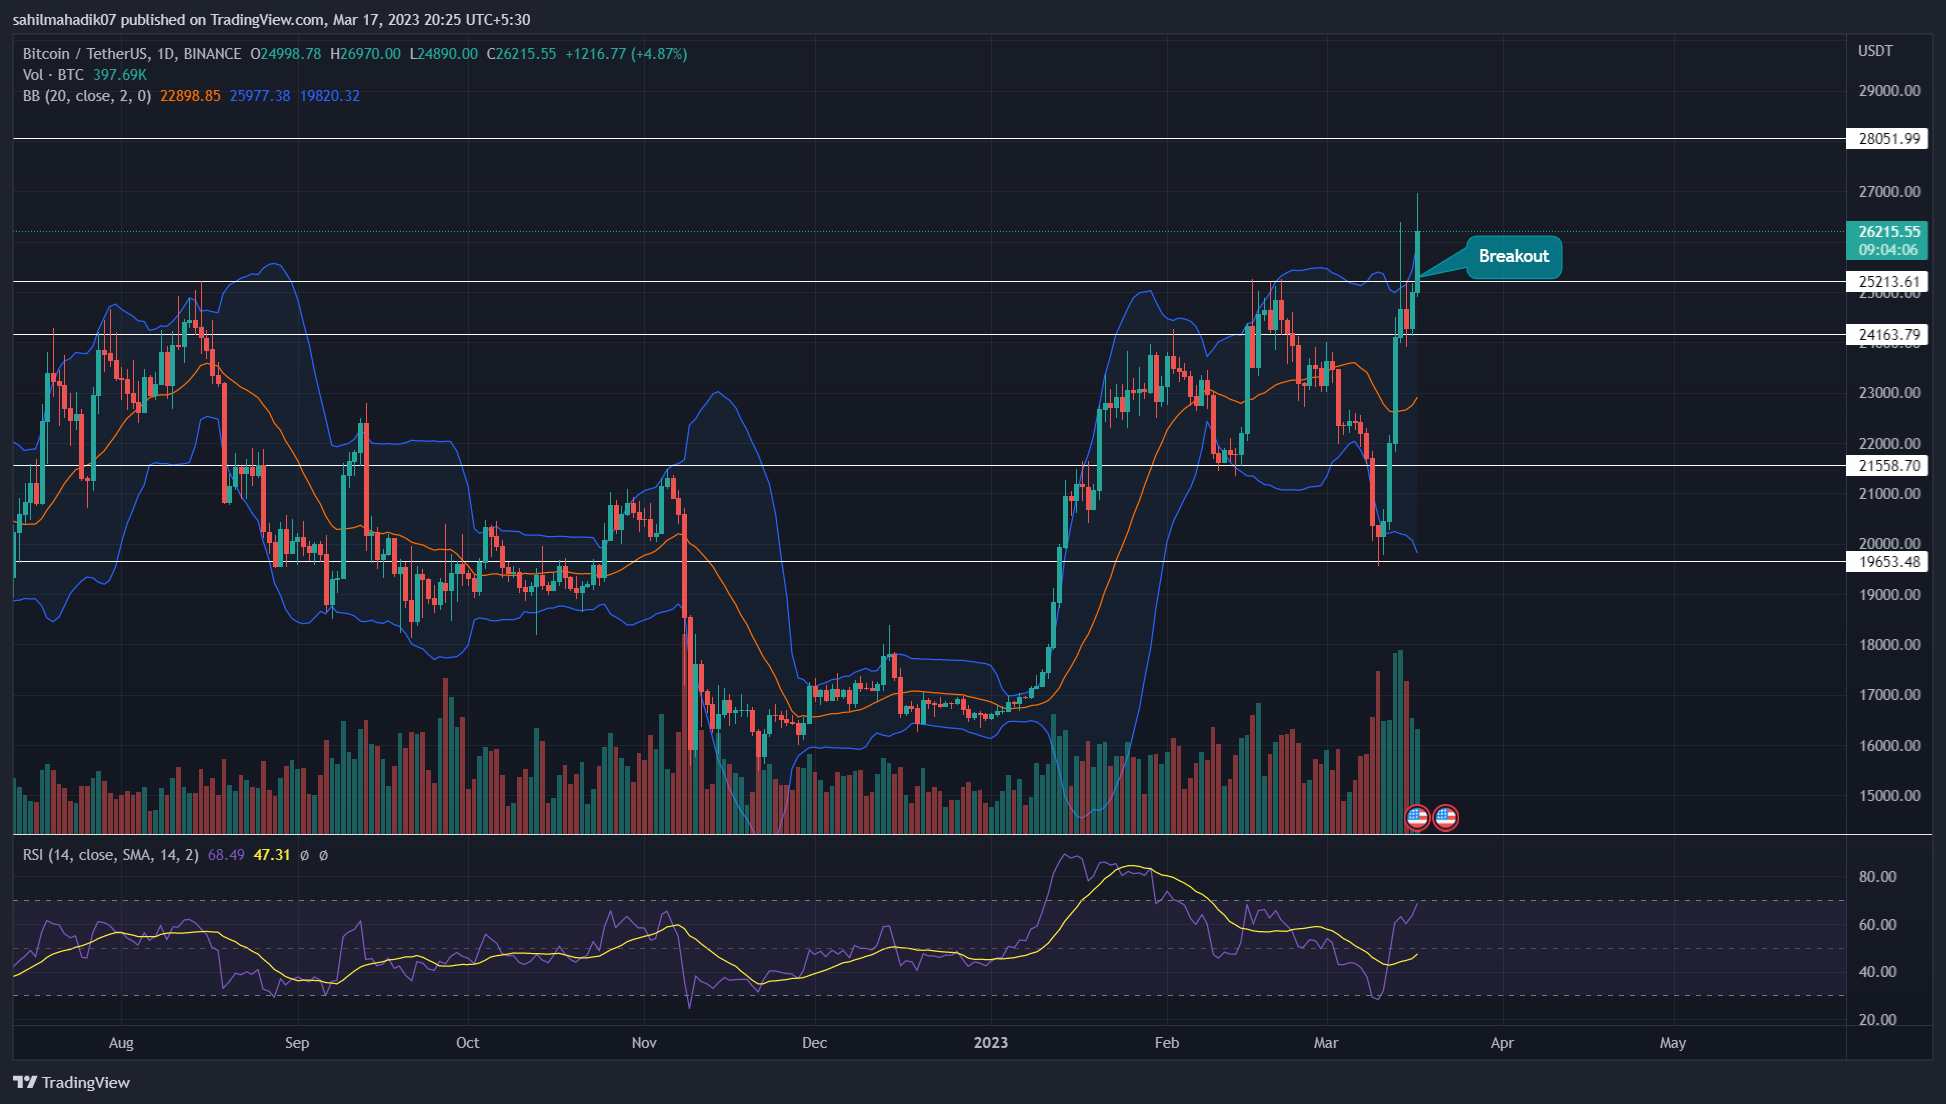
Source-Tradingview
Since last week the Bitcoin price has witnessed an upright growth and recovered the entire losses recorded during the Mid-Feb-to-early March retracement. This recovery also indicates the market participants are interested in buyers’ dips which is a key trait in an established uptrend.
Amid the ongoing rally, the Bitcoin price gave a decisive breakout from the $25200 multi-month resistance. The aforementioned resistance stands as a crucial supply zone for sellers as it initiated the mid-august 2022 downfall and Mid-February 2023 correction.
Trending Stories
Thus, an evident breakout from this resistance indicates the buyers are ready to prolong the bullish rally. If the daily candle closes above the $25200 barrier, interested traders can look for an entry opportunity near the breakout point.
The post-breakout rally could drive the Bitcoin price 5.7% higher to a significant resistance of $18000, followed by $32000.
Technical Indicator
RSI: The daily-RSI slope moving high in bullish territory indicates that Bitcoin’s ongoing rally is sustainable and reflects positive sentiment from market participants.
advertisement
Bollinger band: the rising BTC price breaches the upper band of the Bollinger band indicator reflects the buying pressure is aggressive for the given time. Thus, the coin price could resonate above the $2500 mark before continuing the upward march.
Bitcoin Price Intraday Levels
- Spot rate: $26456
- Trend: Bullish
- Volatility: Low
- Resistance levels- $28000 and $32000
- Support levels- $21500 and $19600
Share this article on:
advertisement
The presented content may include the personal opinion of the author and is subject to market condition. Do your market research before investing in cryptocurrencies. The author or the publication does not hold any responsibility for your personal financial loss.
<!– Close Story–>
- SEO Powered Content & PR Distribution. Get Amplified Today.
- Platoblockchain. Web3 Metaverse Intelligence. Knowledge Amplified. Access Here.
- Source: https://coingape.com/markets/btc-price-prediction-can-bitcoin-breakout-from-this-multi-month-resistance-led-rally-30000/

