BNB price (Binance coin) is down over 25% and trading below $250 against the US Dollar. The price could drop further toward the $200 support.
- Binance coin price is moving lower below the $250 support against the US Dollar.
- The price is now trading below $250 and the 100-day simple moving average.
- There is a key bearish trend line forming with resistance near $280 on the daily chart of the BNB/USD pair (data source from Binance).
- The pair could accelerate further lower if it breaks the $220 support zone.
BNB Price Continues To Bleed
In the past few days, BNB price saw a major decline from well above $280 against the US Dollar. The recent SEC lawsuit against Binance is not helping BNB. It is also putting bearish pressure on Bitcoin and Ethereum.
The last major high was formed near $352 before the price declined heavily. There was a clear move below the $280 and $250 levels. The decline was such that the price tested the key $220 support zone. BNB price is now trading below $250 and the 100-day simple moving average.
A low is formed near $221.2 and the price is now consolidating losses. On the upside, BNB is facing resistance near the $240 level. The first major resistance is near $250. It is close to the 23.6% Fib retracement level of the downward move from the $352 swing high to the $221 low.
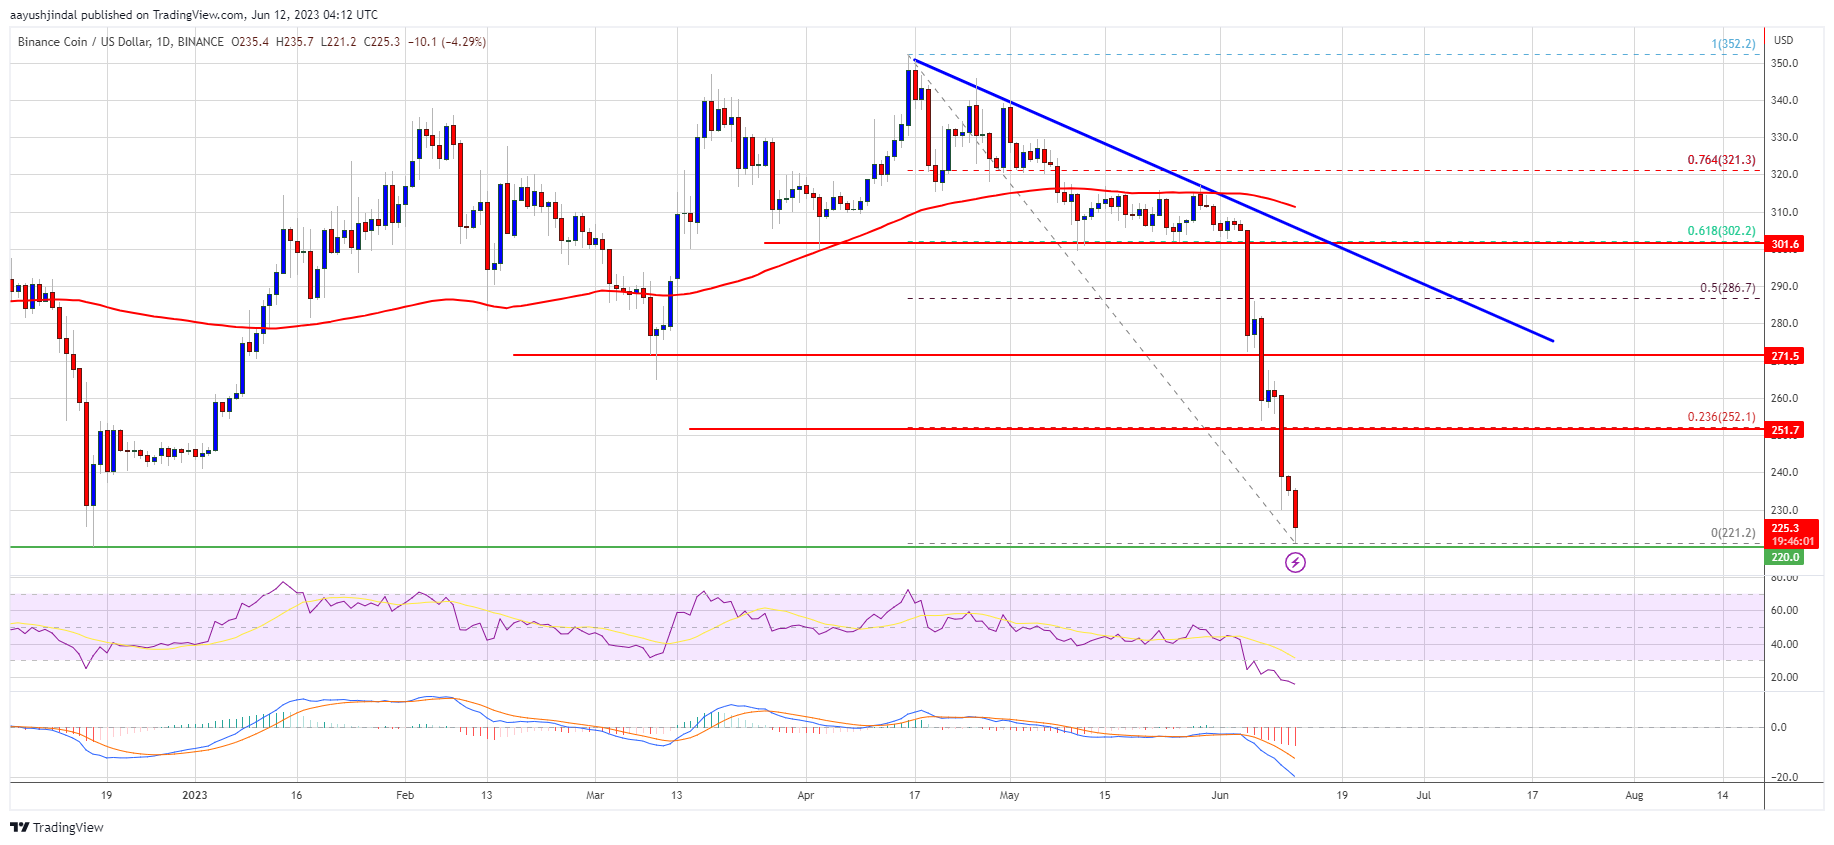
Source: BNBUSD on TradingView.com
The next major resistance is near $270. The main resistance is now near $280 or the trend line or the 50% Fib retracement level of the downward move from the $352 swing high to the $221 low. A clear move above the $280 resistance might start a steady increase. The next major resistance is near the $300 level, above which the price might rise toward the $325 resistance.
More Losses?
If BNB fails to clear the $250 resistance, it could continue to move down. Initial support on the downside is near the $220 level.
The next major support is near the $200 level. If there is a downside break below the $200 support, there could be an extended decline toward the $180 support. Any more losses could send the price toward the $164 support.
Technical Indicators
Daily MACD – The MACD for BNB/USD is gaining pace in the bearish zone.
Daily RSI (Relative Strength Index) – The RSI for BNB/USD is currently below the 50 level.
Major Support Levels – $220, $200, and $180.
Major Resistance Levels – $240, $250, and $280.
- SEO Powered Content & PR Distribution. Get Amplified Today.
- EVM Finance. Unified Interface for Decentralized Finance. Access Here.
- Quantum Media Group. IR/PR Amplified. Access Here.
- PlatoAiStream. Web3 Data Intelligence. Knowledge Amplified. Access Here.
- Source: https://www.newsbtc.com/analysis/bnb/bnb-price-prediction-200/

