SNEAK PEAK
- Blur price analysis shows a bearish trend today.
- The nearest support level for BLUR/USD is $0.5406.
- Resistance at $0.5741 still remains to be broken.
The Blur price analysis is showing that the bears are in control of the market today. After a sharp rise earlier at the start of the week, the price has corrected and is currently trading at $0.5493.
The closest support level for BLUR/USD is at $0.5406, which needs to be defended in order to prevent further declines. On the other hand, resistance still remains at $0.5741.
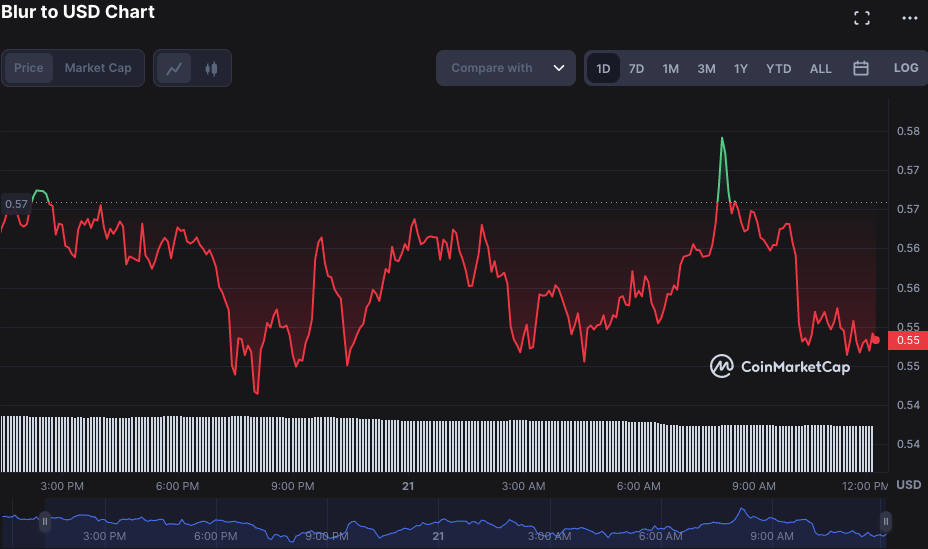
In the past few days, the bulls had a firm grip on the market as they pushed BLUR/USD to new highs above the $0.58 mark; however, today is marked by bearish momentum, and the price has corrected downward from its previous levels as more selling pressure is in the market.
A few hours before, the bulls were seen pushing for a break above $0.57, but the bears have managed to deny them of this feat.
The one-day chart for Blur price analysis reveals that the bears are in control of the market at the moment. The price is currently trading below $0.5741 and is trying to break the support level of $0.5406 in order to reach new lows.
The token price has decreased by 3.58 percent in the last 24 hours. The trading volume is at $88 million, which is lower than the previous one, while the market cap stands at $227 million.
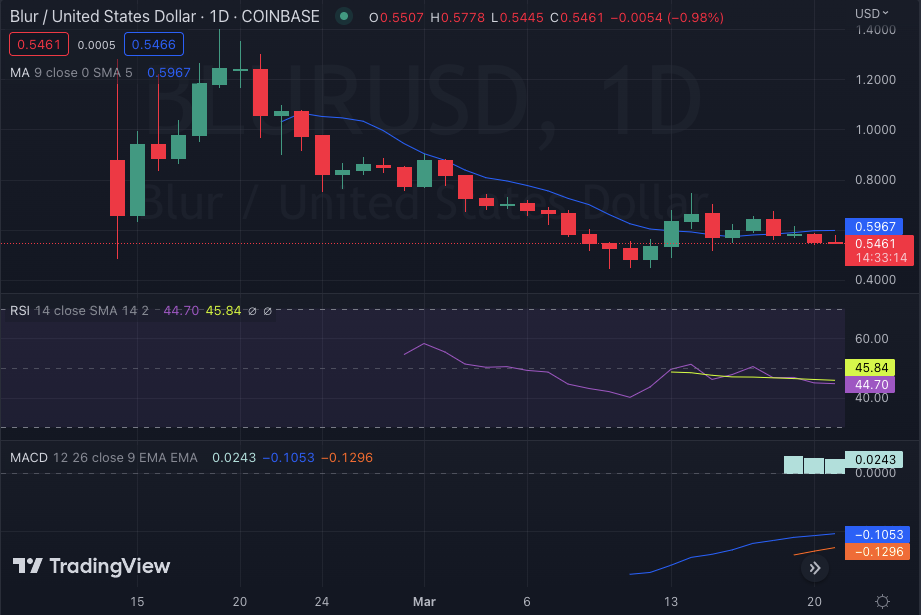
The daily technical indicators are showing bearish signals as the MACD indicator has crossed below the signal line, while the RSI indicator is currently at 44.70. This is a clear sign that the bears are in control of the market and that there’s still more room for further correction as the moving average indicator continues to move lower. The 20-SMA and 50-SMA are still pointing downward, reflecting the bearish trend in the market.
The 4-hour chart for Blur price analysis reveals that the bears have managed to break down the support level of $0.5406 and are currently trading above it. Looking at the intraday chart, we can see that the Blur Price Analysis shows a bearish trend today, with lower highs and lower lows forming a descending triangle pattern.
The day started with a bearish trend and then shifted to a bullish trend, but the bears were able to take control of the market and push the price lower.
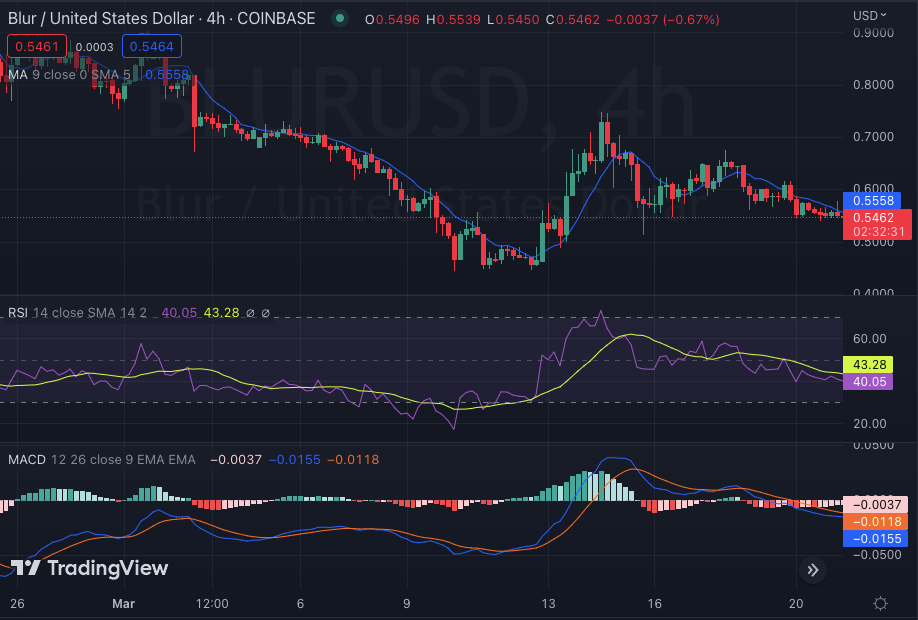
The hourly moving average is $0.5558, just above the current market price. The moving average convergence/divergence (MACD) indicator is still below the signal line, with the histogram declining further, showing that the bearish trend is still in control. The Relative Strength Index (RSI) is currently at 40.05, showing that the market is still bearish and there’s more room for further correction.
Overall, Blur’s price analysis shows a bearish trend today, and if the support level of $0.5406 holds, then there’s potential for recovery in the near term. However, if it breaks down, we can expect to see more declines in the upcoming days. Therefore, support and resistance levels should be closely monitored in order to determine the future direction of the price.
Disclaimer: Cryptocurrency price is highly speculative and volatile and should not be considered financial advice. Past and current performance is not indicative of future results. Always do your own research and consult with a financial advisor before making investment decisions.
- SEO Powered Content & PR Distribution. Get Amplified Today.
- Platoblockchain. Web3 Metaverse Intelligence. Knowledge Amplified. Access Here.
- Source: https://investorbites.com/blur-price-analysis-21-03/

