- Bitcoin has dipped 11% in the past 30 days.
- Traders eye historical rally parallels amid the 2023 bear market.
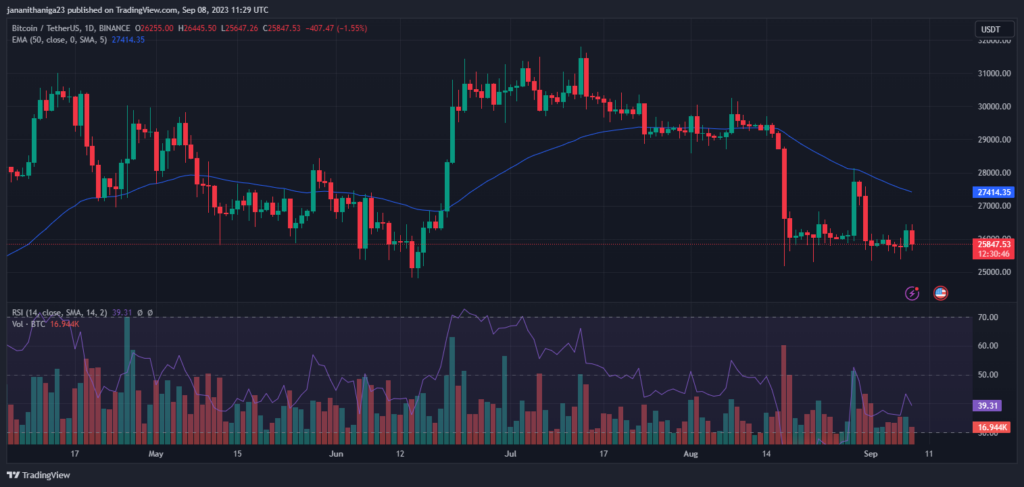
In Q4 2023, Bitcoin, the largest market capitalization holder, faced a relentless bearish pressure that sent shockwaves throughout the market. As September rolled in, BTC found itself locked in a battle for stability, with prices oscillating between $26,409 and a low of $25,404, marking its lowest point in nearly five months. This led to a decline of 11% in the past 30 days.
Even in the face of adversity, Bitcoin continued to captivate the world’s attention with anticipation for 2024. As the impending Bitcoin halving and the awaited SEC approval of Bitcoin ETFs hold the promise of reshaping the cryptocurrency landscape.
Meanwhile, Traders and investors drew parallels between the current downtrend and Bitcoin’s historical dips in 2015-16 and 2019-20, where the cryptocurrency orchestrated impressive comebacks, sparking optimism among the faithful investors.
Adding to it, some experts predict that the April 2024 block subsidy halving could be a turning point for Bitcoin’s price performance. It’s speculated that BTC/USD might soar to $46,000 by then, although potential losses loom.
Meanwhile, According to Bitcoin’s monthly returns chart, BTC has had six “negative Septembers” in a row since 2016. Within these six years, 2019 witnessed the greatest loss of 13.47%, while 2022 losses were relatively lower at 3.12%. This historical context makes the community speculate whether the bears will get stronger.
Recent insights from the analytics company IntoTheBlock shed light on the activities of major Bitcoin holders. Addresses owning at least 0.1% of all circulating Bitcoin, valued at over $500 million, have witnessed a staggering $1.5 billion increase in their holdings within the final fortnight of August.
Where is The Price of BTC Headed ?
An analysis of Bitcoin’s recent price movements reveals an underlying bearish trend on the daily chart. The 50-day exponential moving average (EMA) now hovers at $27,428, underscoring the prevailing bearish sentiment. With the daily relative strength index (RSI) at 42, Bitcoin edges closer to oversold territory. Meanwhile, it has experienced a modest uptick in trading volume, rising by 4.68% in the past 24H.
This suggests that the bears are capitalizing on rallies near $1,650, and this narrow-range trading may not persist for long. If the price continues to decline below $1,600, it could signify the bears taking control, with minor support at $1,550. And a potential further drop to $1,368.
On the upside, the bears are expected to fiercely defend the zone between $1,650. If buyers manage to overcome this barrier, there is potential for the pair to surge toward the 50-day SMA at $1,772.
Will BTC Break its Bearish Pressure? Share your thoughts by tweeting us at @The_NewsCrypto
- SEO Powered Content & PR Distribution. Get Amplified Today.
- PlatoData.Network Vertical Generative Ai. Empower Yourself. Access Here.
- PlatoAiStream. Web3 Intelligence. Knowledge Amplified. Access Here.
- PlatoESG. Automotive / EVs, Carbon, CleanTech, Energy, Environment, Solar, Waste Management. Access Here.
- PlatoHealth. Biotech and Clinical Trials Intelligence. Access Here.
- ChartPrime. Elevate your Trading Game with ChartPrime. Access Here.
- BlockOffsets. Modernizing Environmental Offset Ownership. Access Here.
- Source: https://thenewscrypto.com/bitcoins-price-analysis-relief-rally-on-the-horizon/

