Published 30 mins ago
The short-term trend for Bitcoin price is sideways, where it wobbles between the $24500-$18350 barrier. During the consolidation, the coin price has repeatedly retested the bottom support, validating it as a strong accumulation zone. Amid the recent sell-off in September, the BTC price dropped to the $18350 mark, trying to replenish the bullish momentum.
advertisement
Key points:
- Steady growth in volume activity during the recent downfall indicates an established downtrend
- The 20-day EMA at $19600 sets an additional barrier against buyers.
- The intraday trading volume in Bitcoin is $32 Billion, indicating a 20% loss.
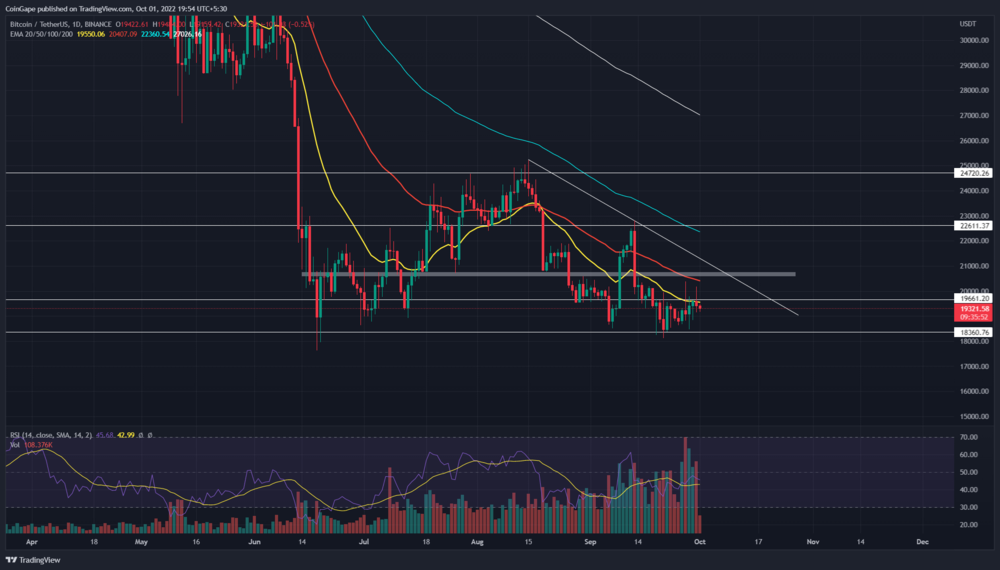
Source-Tradingview
On September 19th, the Bitcoin price retested the $18350 support for the fourth time in the last three months. Since then, the coin buyers have made several attempts to bounce off this support, but the widespread negative sentiment in the market has limited its growth.
Thus, the Bitcoin price resonated between the $19600 and $18350 mark over the past two weeks. This narrow range reflects uncertainty among market participants and a no-trading zone. Moreover, the long-wick rejection at $19600 resistance indicates the traders are actively selling at higher levels.
Trending Stories
The coin price currently trades at $19330 and shows $0.47 intraday.
Anyhow, a consolidation phase after a directional drop usually leads to the resumption of prevailing downfall. Therefore, once the coin price gave a daily candle closing below the $18300 mark, the coin holder may witness a 7% drop to $ hit $17000 support.
However, if the market sentiment improves, the coin price could breach $19600, offering an early sign of recovery. Moreover, the buyers would need to surpass the combined resistance of $20800 and the resistance trendline to obtain a safe entry.
Technical Indicator
Relative Strength Index: the daily-RSI chart shows an evident bullish divergence concerning the recent retests to the $183500 support. This divergence reflects the rising bullish momentum at this support which bolstered the $19600 breakout.
advertisement
EMAs: the downsloping crucial EMAs(20, 50, 100, and 200) project the overall market trend is strongly bearish. Moreover, the 20-day EMA acts as a constant resistance and could assist sellers in plummeting the Bitcoin price lower.
Bitcoin Price Intraday Levels
- Spot rate: $19332
- Trend: Sideways
- Volatility: High
- Resistance level- $19600 and $20600
- Support level- $18000 and $16500
Share this article on:
The presented content may include the personal opinion of the author and is subject to market condition. Do your market research before investing in cryptocurrencies. The author or the publication does not hold any responsibility for your personal financial loss.

