SNEAK PEEK
- Bitcoin’s price decline sparks concerns amidst bearish momentum.
- Oversold indicators hint at a potential rebound for BTC.
- Traders urged caution as selling pressure grows in the market.
Trading concerns about a price decline to the $20k to $25k range have grown as Bitcoin (BTC) has retested the $26k mark. The social dominance of BTC has increased sharply, a sign of fear. Fear signals raise the likelihood of a rebound soon as investors look to reinvest at lower prices. There are worries that the current market correction might persist.
😱 With #Bitcoin revisiting the $26k level, traders are showing increased worries of prices falling back to the $20k to $25k range. $BTC social dominance has jumped high again, typically a sign of fear. Fear signals increase the probability of a rebound. https://t.co/hwDaEwsmLf pic.twitter.com/zj6j9HKfN9
— Santiment (@santimentfeed) May 18, 2023
Despite the price of Bitcoin reaching an intraday high of $27,466.53, bears gained momentum and took control of the market, causing prices to fall to an intraday low of $26,415.10 in the past 24 hours. The price of BTC was $26,907.06 at the time of writing, down 1.03% from its previous closing as this downward trend persisted.
BTC’s market capitalization and 24-hour trading volume decreased by 1.16% and 0.32% to $521,393,055,794 and $14,918,423,391, respectively. This slight decline may be attributed to general market volatility and unpredictability, but many investors remain upbeat about BTC’s long-term prospects.
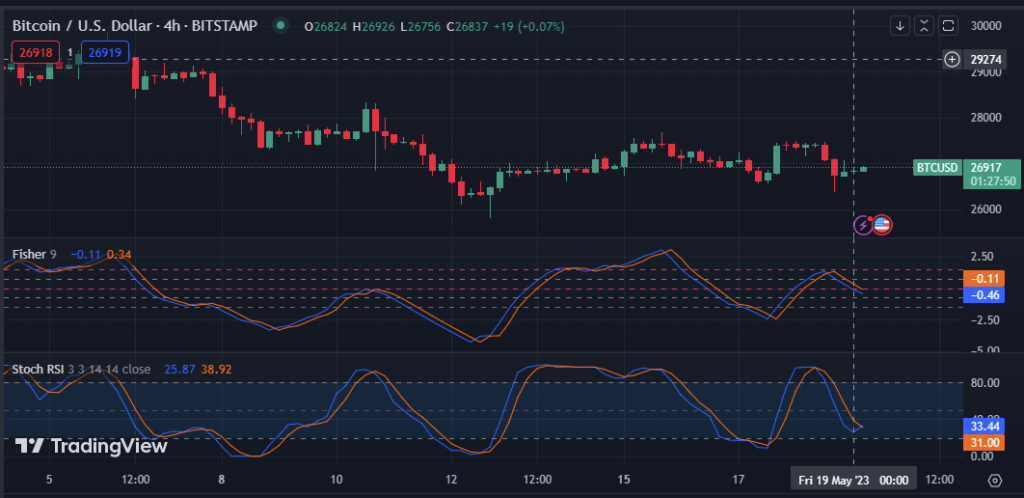
The Fisher Transform line, which has a value of -0.46 and is below the signal line on the BTC market’s 4-hour price chart, indicates that the market is currently oversold and a potential buy signal is approaching. The reversal will be apparent if the Fisher Transform Line successfully crosses the signal line.
The stochastic RSI on the 4-hour price chart of the BTC market shows a reading of 33.44, indicating that the market is currently oversold and may soon reverse bullishly to the upside. This implies a chance for investors to buy at a discount and profit from a subsequent price increase.
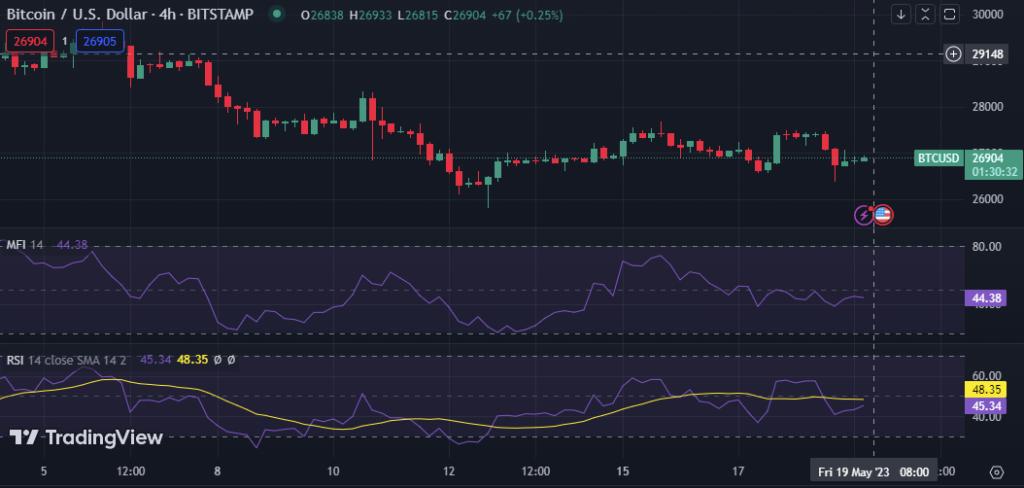
Since the Relative Strength Index (RSI), currently reading 45.34, falls below its signal line and into the oversold region, BTC may still be under short-term negative pressure. This means that traders might wait to enter an extended position until the RSI crosses above its signal line and leaves the oversold area.
By indicating escalating selling pressure, the Money Flow Index (MFI), which has a reading of 44.38 and is trending downward, supports the bearish momentum in BTC. Traders should exercise caution when evaluating long positions if the MFI declines and breaks below the oversold level. This movement may signal the start of a more severe downward trend.
In conclusion, as Bitcoin faces bearish momentum and selling pressure, oversold indicators offer hope for a potential rebound. Traders remain cautious amidst market volatility.
Disclaimer: Cryptocurrency price is highly speculative and volatile and should not be considered financial advice. Past and current performance is not indicative of future results. Always research and consult with a financial advisor before making investment decisions.
- SEO Powered Content & PR Distribution. Get Amplified Today.
- PlatoAiStream. Web3 Data Intelligence. Knowledge Amplified. Access Here.
- Minting the Future w Adryenn Ashley. Access Here.
- Buy and Sell Shares in PRE-IPO Companies with PREIPO®. Access Here.
- Source: https://investorbites.com/bitcoin-btc-price-analysis-05-19/

