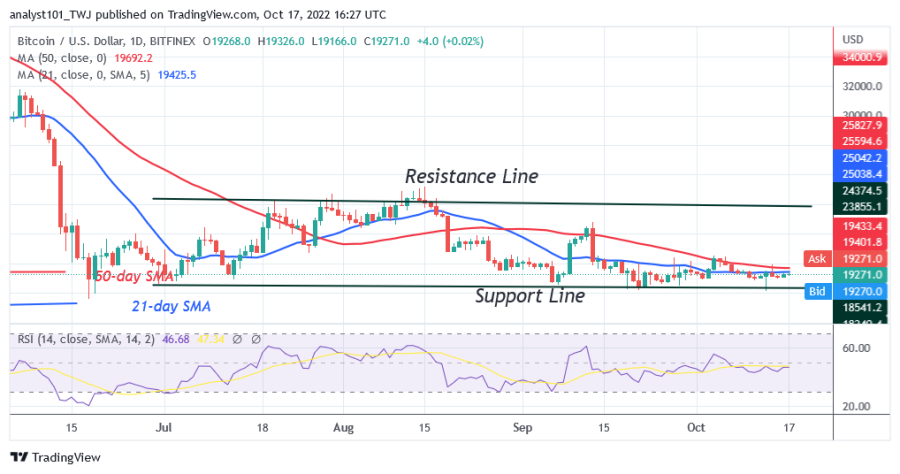
Bitcoin (BTC) price is in a downtrend but has resumed consolidation above $19,000 support.
Bitcoin price long term forecast: bearish
Since October 10, the price’s upward movement has been slowed down by the 21-day line SMA. On October 13, the BTC price dropped to a low of $18,161 while the bulls bought the dips. The following day, buyers pushed the cryptocurrency above the moving average lines but were rejected at the high of $19,947. In the two scenarios, the price action has shown a long candlestick tail at the previous low and a long candlestick wick at the recent high
The long candlestick tail indicates strong buying pressure at the lower price levels. The candlestick wick indicates strong selling pressure at higher price levels. This is one reason for the recent sideways movement. Nevertheless, Bitcoin is trading marginally due to the presence of indecisive small-body candles called doji. It is contained below the 21-day line SMA
Bitcoin indicator display
The BTC price is relatively stable at the 46 level of the Relative Strength Index for the 14 period. The largest cryptocurrency risks a decline as the price bars are below the moving average lines. The moving average lines are sloping horizontally, indicating a sideways trend. Bitcoin is in a bullish momentum as it is above the 70% area of the daily stochastic. The bullish momentum is approaching the overbought area of the market.

Technical indicator
Key resistance zones: $30,000, $35,000, $40,000
Key support zones: $25,000, $20,000, $15,000
What is the next direction for BTC/USD?
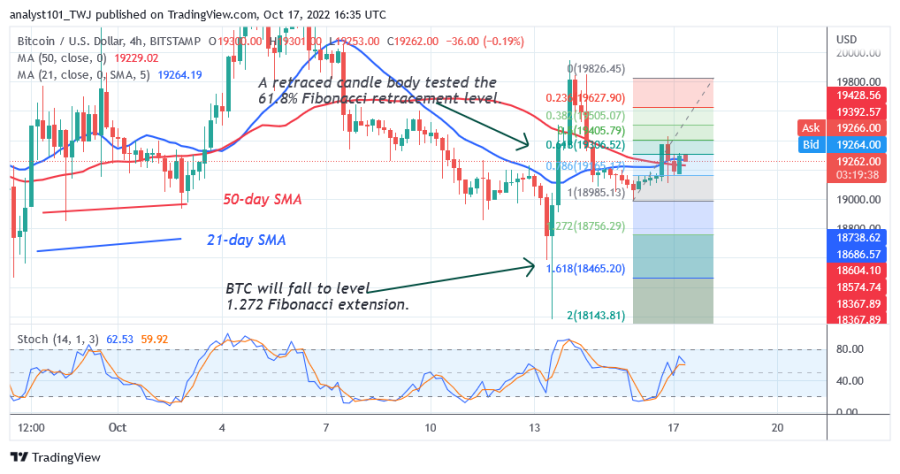
On the 4-hour chart, Bitcoin has broken above the moving average lines. The upside moves have reached a bullish exhaustion. In the downtrend from October 15, Bitcoin corrected upwards and a candlestick tested the 61.8% Fibonacci retracement level. This correction means that the cryptocurrency will fall to the 1.618 Fibonacci Extension level or $18,465.20.

Disclaimer. This analysis and forecast are the personal opinions of the author and are not a recommendation to buy or sell cryptocurrency and should not be viewed as an endorsement by CoinIdol. Readers should do their own research before investing in funds.


