Bitcoin (BTC), the world’s leading cryptocurrency, continues to face challenges in reclaiming the $28,000 level amid rising US treasury yields, a stronger dollar, and geopolitical uncertainties.
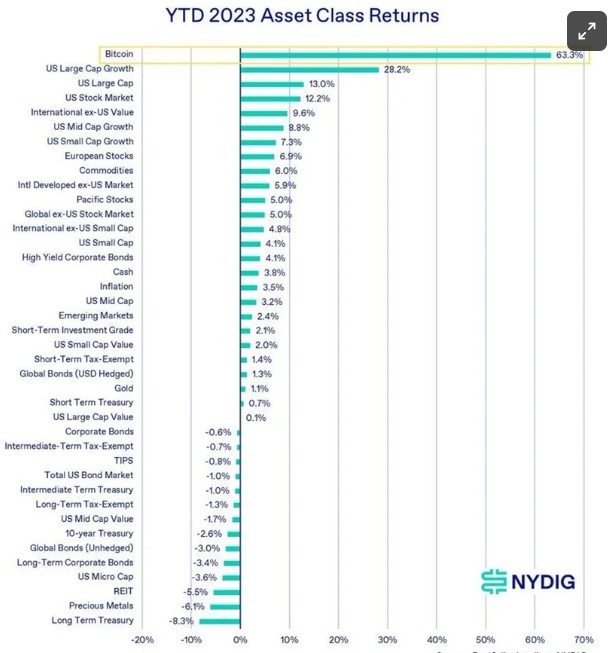
However, according to a report by the digital asset research firm Reflexivity, despite these obstacles, Bitcoin remains the standout performer among asset classes in 2023, with an impressive year-to-date (YTD) return of 63.3%.
This exceptional performance has surpassed returns from US large-cap growth stocks (28%), US large-cap stocks (13%), bonds, commodities, and REITs, according to a report from New York-based Bitcoin investment firm NYDIG.
ETH/BTC Ratio Reflects Risk Appetite And BTC’s Strength
According to the firm’s latest analysis of the current state of the Bitcoin market, there is a notable importance in monitoring Bitcoin’s market cap dominance, which measures Bitcoin’s market capitalization as a percentage of the total crypto market capitalization.
Market participants often view this metric as a risk gauge for the broader crypto market. Just as traditional markets experience cycles, with early stages marked by capital concentration in a select few high-quality assets that gradually disperse into riskier assets, the crypto market follows a similar pattern.
The cycle commences with capital concentrated in Bitcoin, then dispersion into Ethereum (ETH) and eventually other altcoins. The cycle concludes with capital flooding into high-risk assets, as witnessed in the memecoin frenzy of 2021.
The report’s chart illustrates the rising dominance of Bitcoin, indicating a healthy concentration of capital into the leading asset. Bitcoin’s sustained dominance suggests that the crypto market is stable, with significant capital still flowing into Bitcoin.
Alongside monitoring Bitcoin dominance, another key indicator of risk-taking behavior in the crypto market is the ETH/BTC ratio, which compares Bitcoin’s performance to Ethereum, the second-largest cryptocurrency by market capitalization.
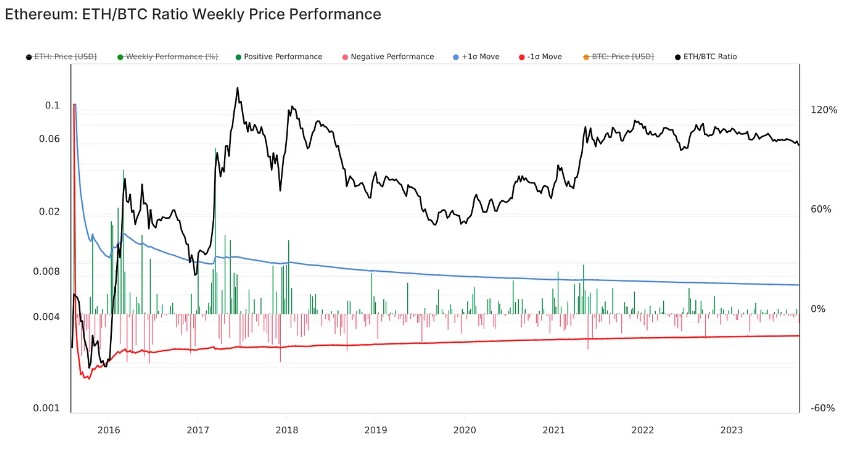
The chart demonstrates a downward trend in the ETH/BTC ratio since the Merge in September 2022, which, according to the report, both Bitcoin dominance and the ETH/BTC ratio will be crucial to watch for any potential shift from a Bitcoin-dominated market regime into higher-risk assets.
Bitcoin Eyes Bullish Momentum
After a two-month consolidation period between the $26,000 and $27,000 range, BTC finally experienced a surge of bullish momentum, breaking the pattern and climbing to the upside.
However, the cryptocurrency’s upward trajectory was halted as it encountered a formidable resistance wall in the mid-term, reaching $28,600 on October 2nd and facing a significant hurdle at $28,700.
This resistance level poses one of the final challenges preventing BTC from revisiting the $30,000 mark, last seen in August.
Despite the setback, Bitcoin currently trades above its crucial 50-day and 200-day moving averages (MAs), indicating the potential for another attempt to breach previously lost levels.
Market analysts and enthusiasts are closely watching the $27,700 mark, as a successful break could signal the formation of a perfect ‘W’ pattern, with a target set at $28,100.
On this matter, renowned crypto YouTuber and founder of Crypto Sea, known as ‘Crypto Rover,’ highlights the significance of the $27,700 level as a potential catalyst for Bitcoin’s next move.
According to the analyst’s latest post on X (formerly Twitter), a successful breakthrough could reignite bullish sentiment and pave the way for a push toward the $28,100 target.
BTC is trading at $27,300, experiencing a modest decline of 0.6% over the past 24 hours. However, the cryptocurrency has recorded notable gains of 4.4% and 6% over fourteen and thirty days, respectively.
Featured image from Shutterstock, chart from TradingView.com
- SEO Powered Content & PR Distribution. Get Amplified Today.
- PlatoData.Network Vertical Generative Ai. Empower Yourself. Access Here.
- PlatoAiStream. Web3 Intelligence. Knowledge Amplified. Access Here.
- PlatoESG. Carbon, CleanTech, Energy, Environment, Solar, Waste Management. Access Here.
- PlatoHealth. Biotech and Clinical Trials Intelligence. Access Here.
- Source: https://www.newsbtc.com/bitcoin-news/bitcoin-dominates-2023-surges-past-stocks-and-bonds-with-63-ytd-growth/

