- New Zealand central bank, RBNZ maintained its OCR at 5.50% but surprised markets with lower OCR forecasts for 2024 and 2025.
- A less hawkish RBNZ has triggered a sell-off in the Kiwi (-1% intraday against the USD), the worst-performing currency among the majors.
- The current weak outlier movement of the NZD has triggered a potential short-term bearish mean reversion scenario for the AUD/NZD cross pair.
- Watch the 1.0700 key short-term resistance on AUD/NZD.
The Kiwi has been walloped hard to the downside on an intraday basis during today, Asian session as it plummeted by -1% against the US dollar at this time of the writing.
It seems that the “buy the rumour, sell the news” mantra has been inflicted on the Kiwi; in the past month, RBNZ officials have maintained hawkish vibes in their public speeches that pushed the NZD to be the top performer against the US dollar among the major currencies with a current peak gain of +2% seen on 22 February 2024 based on a one-month rolling basis.
Today’s abrupt weakness in the NZD has been attributed to the softer hawkish signal telegraphed to the market participants as the possibility of one interest rate hike in 2024 by RBNZ has been greatly reduced.
RBNZ has turned less hawkish
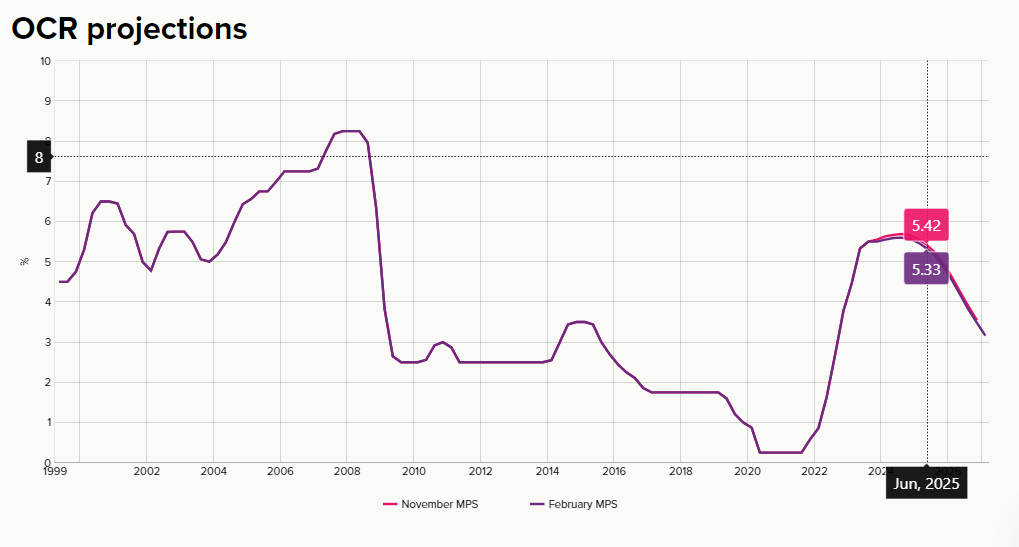
Fig 1: Latest RBNZ Official Cash Rate projection as of 28 Feb 2024 (Source: RBNZ website, click to enlarge chart)
The RBNZ maintained its official cash rate (OCR) at 5.50% as expected but what goes against the consensus view is the latest trajectory forecasts of its OCR. The RBNZ now expects the OCR rate to be at 5.59% in June 2024, a reduction of 8 basis points (bps) from the prior 5.67% forecasted in the November 2023 monetary policy meeting.
Also, the latest forecast for its OCR in March 2025 has been reduced to 5.47% from the prior projection of 5.56%, a further reduction to 5.33% is expected in June 2025 (prior forecast at 5.42%). All in all, this latest set of forecasts has reduced the probability significantly of a rate hike in 2024 while increasing the chances of a rate cut in early 2025 (see Fig 1).
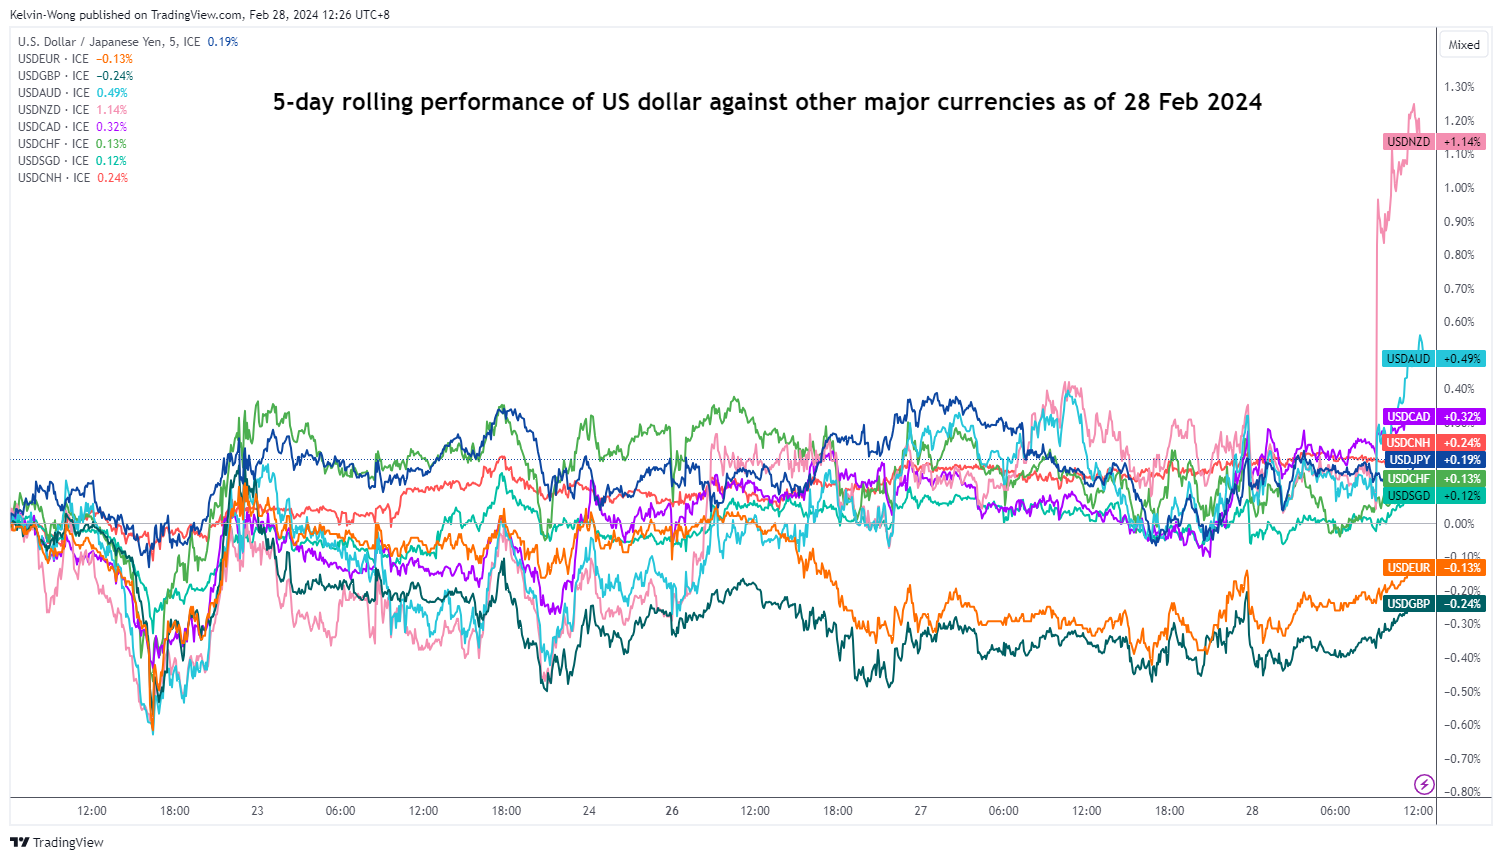
Fig 2: Rolling 1-month performance of US dollar against other major currencies as of 28 Feb 2024 (Source: TradingView, click to enlarge chart)
Today’s underperformance of the NZD against the US dollar has seen the USD/NZD cross rate spiked up with a gain of +1.14% on a 5-day rolling performance basis at this time of the writing; also an outlier among other major currencies performances (see Fig 2)
AUD/NZD spiked up towards 1.0700 key short-term resistance
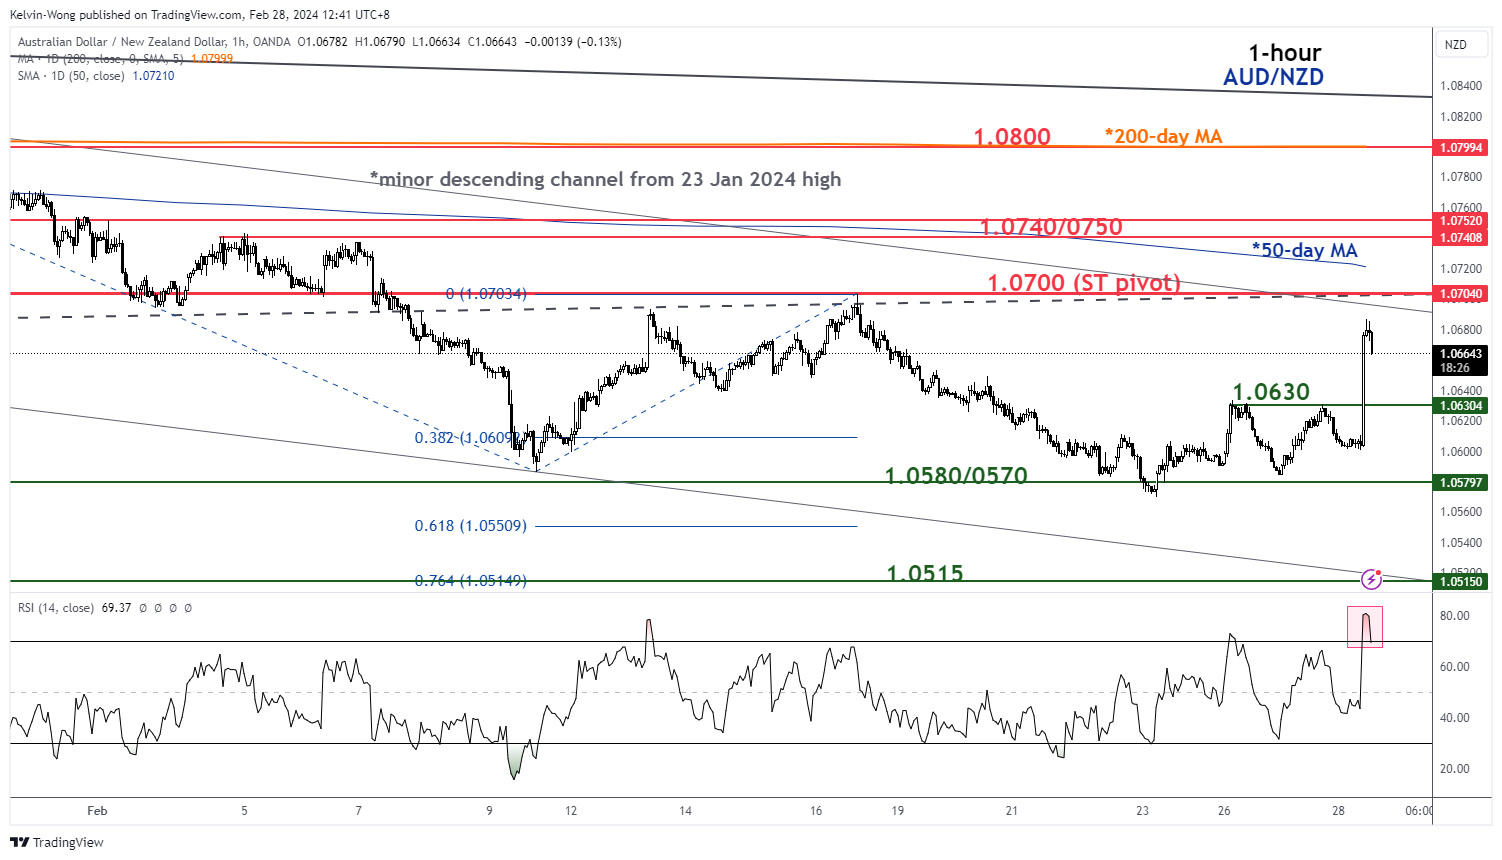
Fig 3: AUD/NZD short-term trend as of 28 Feb 2024 (Source: TradingView, click to enlarge chart)
Given the current sharp movement of the NZD on the weak side, there may be a potential short-term mean reversion scenario that can play out on the AUD/NZD cross-pair at this juncture.
The AUD/NZD has spiked up by +86 pips from today, Asian session intraday low of 1.0600, and almost hit a key short-term pivotal resistance of 1.0700 (current intraday high of 1.0686 at this time of the writing).
The 1.0700 pivotal resistance is likely a potential inflection level as it is defined by several elements such as the upper boundary of the minor descending channel in play since 23 January 2024 high, minor swing high area of 16 February 2024, close to 2 times Fibonacci extension of the recent up move from 23 February 2024 low, and downward sloping 50-day moving average hovering right above 1.0700.
In addition, the hourly RSI momentum indicator has started to inch down from an extreme overbought level of 80.8 which increases the odds of a short-term mean reversion decline scenario.
If the 1.0700 short-term pivotal resistance does not surpass the upside, the AUD/NZD may see a minor slide to expose the near-term supports at 1.0630 and1.0580/0570. A break below 1.0570 sees the next intermediate support coming in at 1.0515 (also the lower boundary of the minor descending channel).
However, a clearance above 1.0700 invalidates the bearish scenario for a squeeze-up to expose the next intermediate resistances at 1.0740/0750 and 1.0800 (also the 200-day moving average).
Content is for general information purposes only. It is not investment advice or a solution to buy or sell securities. Opinions are the authors; not necessarily that of OANDA Business Information & Services, Inc. or any of its affiliates, subsidiaries, officers or directors. If you would like to reproduce or redistribute any of the content found on MarketPulse, an award winning forex, commodities and global indices analysis and news site service produced by OANDA Business Information & Services, Inc., please access the RSS feed or contact us at [email protected]. Visit https://www.marketpulse.com/ to find out more about the beat of the global markets. © 2023 OANDA Business Information & Services Inc.
Passionate about connecting the dots in the financial markets and sharing perspectives around trading and investment, Kelvin Wong is an expert in using a unique combination of fundamental and technical analyses, specializing in Elliott Wave and fund flow positioning, to pinpoint key reversal levels in the financial markets.
In addition, over the last ten years, Kelvin has conducted numerous market outlook and trading-related seminars, as well as technical analysis training courses, for thousands of retail traders.
Latest posts by Kelvin Wong (see all)
- SEO Powered Content & PR Distribution. Get Amplified Today.
- PlatoData.Network Vertical Generative Ai. Empower Yourself. Access Here.
- PlatoAiStream. Web3 Intelligence. Knowledge Amplified. Access Here.
- PlatoESG. Carbon, CleanTech, Energy, Environment, Solar, Waste Management. Access Here.
- PlatoHealth. Biotech and Clinical Trials Intelligence. Access Here.
- Source: https://www.marketpulse.com/forex/aud-nzd-technical-squeezed-up-towards-key-1-0700-resistance-ex-post-rbnz/kwong

