
Published 1 hour ago
The Apecooin price currently trapped in a narrow consolidation phase revealed the formation of a bearish pennant pattern. This technical structure is one of the famous bearish continuation patterns which intensifies the underlying selling pressure once complete. However, an aggressive downfall may not be the only answer to this pattern and therefore, the coin holders should closely observe the price behavior near it.
Key points:
- The ApeCoin price within the triangle pattern has entered a no-trading zone
- A breakout opportunity from the triangle pattern will release the Apecoin price from ongoing uncertainty.
- The intraday trading volume in Apecoin is $103.2 Million, indicating a 23.9% loss
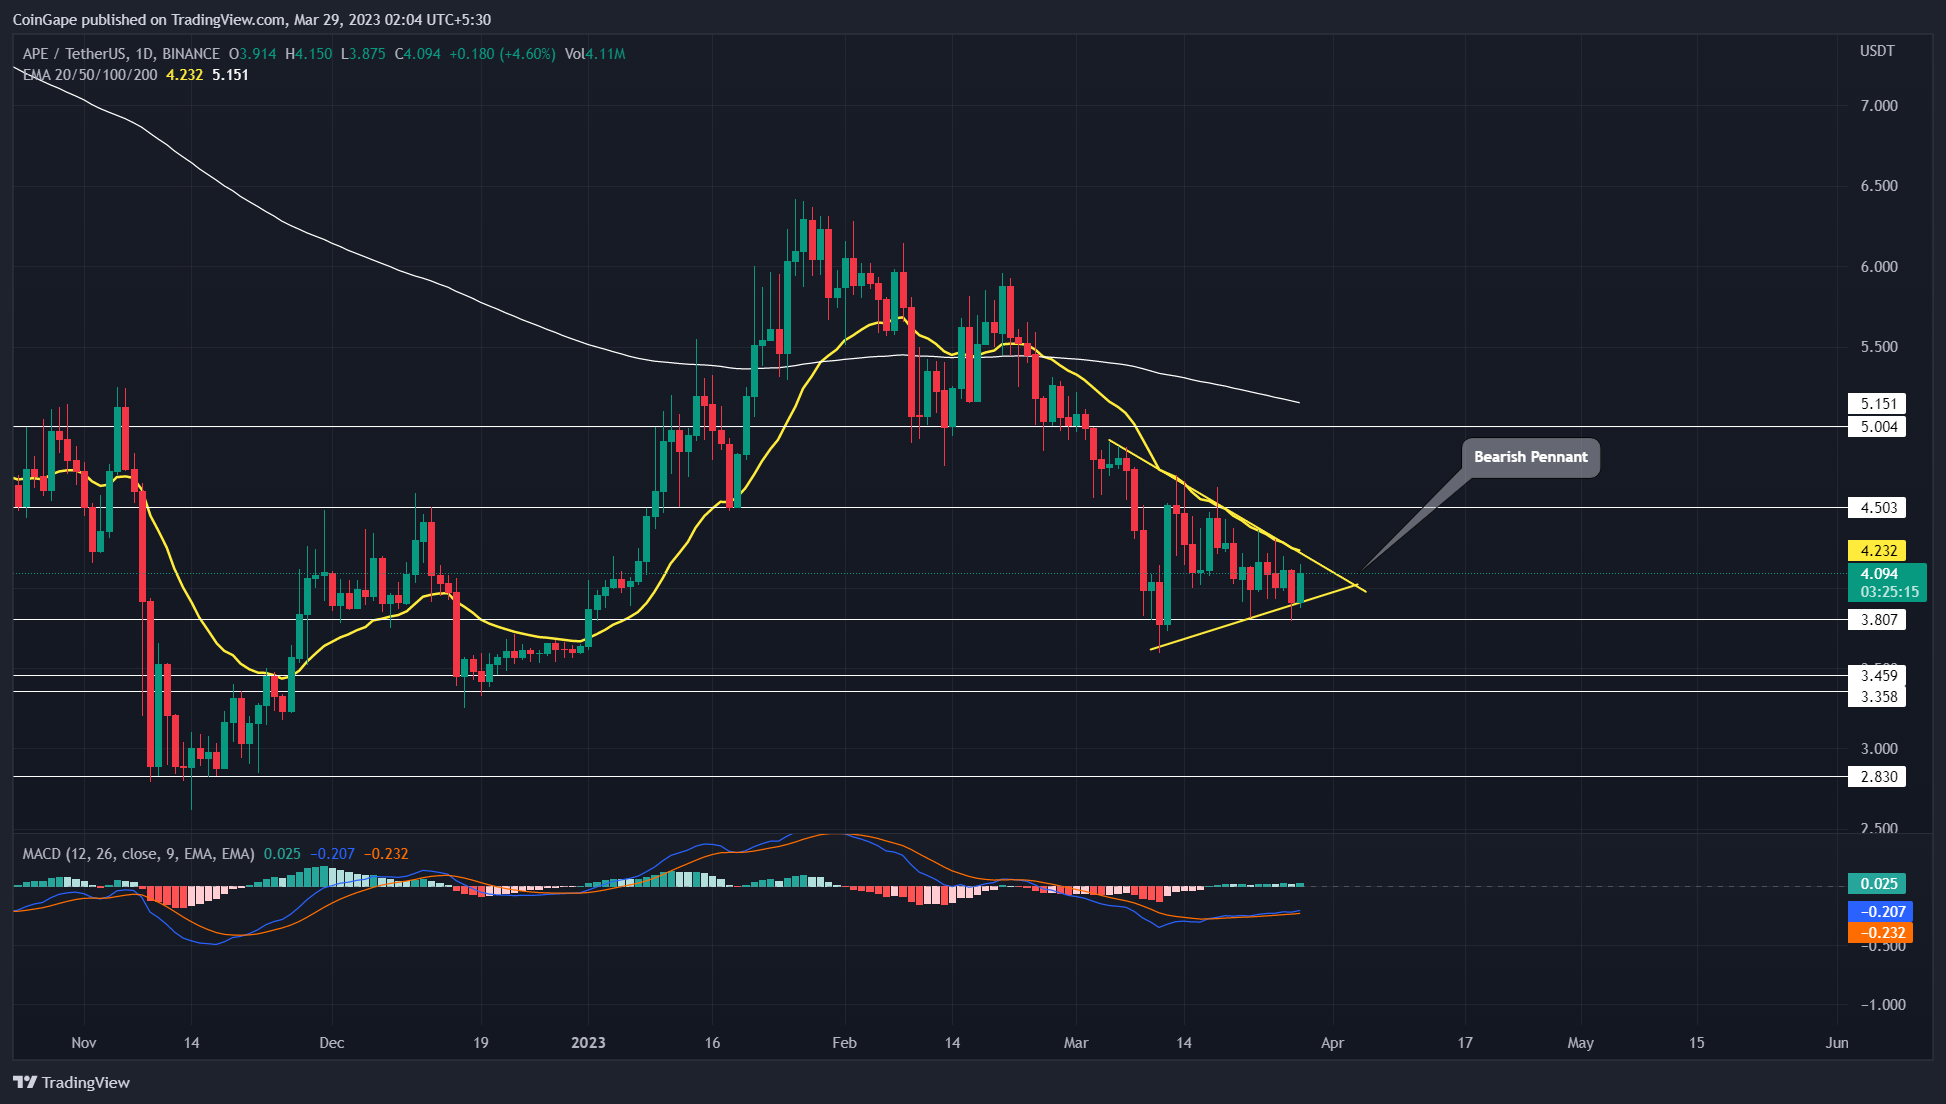
Source-Tradingview
The ongoing downtrend in the Apecoin coin price witnesses a temporary sideways trend as the broader market sentiment suffers from uncertainty. For the past three weeks, the coin price has been resonating between two converging trendlines, reflecting a triangle-shaped pattern.
Trending Stories
Furthermore, a triangle pattern after a sharp downfall indicates the formation of a bearish pennant pattern. In theory, this pattern forms a short break period allowing sellers to check stability at a lower level and replenish the bearish momentum.
Thus, as the coin price nears the triangle’s peak, the traders will witness a breakdown opportunity. As per the technical setup, the Apecoin price is more likely to breach the lower trendline and signal the resumption of the prevailing downtrend.
Also Read: Top 6 Liquid Staking Platforms On Ethereum
This potential breakdown will accelerate the selling press and may plunge the Apecoin price to November 2022 bottom support of $2.83.
On a contrary note, a bullish breakout from the pattern’s resistance is not completely off the chart, and therefore traders should break out before positioning their funds in the market.
Technical Indicator
MACD: multiple crossovers between the MACD(blue) and signal(orange) lines accentuate the ongoing uncertainty in the market.
EMAs: The 20-day EMAs slope aligned with the triangle pattern’s resistance trendline offers additional resistance against buyers.
Apecoin Intraday Price Levels
- Spot price: $4.115
- Trend: Bullish
- Volatility: High
- Resistance level- $4.5 and $5
- Support level- $3.8 and $3.5
Share this article on:
advertisement
The presented content may include the personal opinion of the author and is subject to market condition. Do your market research before investing in cryptocurrencies. The author or the publication does not hold any responsibility for your personal financial loss.
<!– Close Story–>
- SEO Powered Content & PR Distribution. Get Amplified Today.
- Platoblockchain. Web3 Metaverse Intelligence. Knowledge Amplified. Access Here.
- Source: https://coingape.com/markets/apecoin-price-wobbles-make-or-break-situation/

