At Glassnode, we believe that reliable data is the backbone of successful trading strategies and decisions. In that sense, on-chain data, encompassing information on money flows, profitability levels, and sentiment of digital asset market participants derived straight from the blockchain, offers an untapped source of potential alpha.
However, professionals from traditional financial sectors often exhibit a degree of scepticism regarding the applicability of blockchain-derived data for meaningful trading strategies. To address these reservations head-on, Glassnode developed an innovative approach to harnessing the predictive power of this data.
Using this approach, which relies both on the meaningfulness of our data and advanced machine learning algorithms, our Data Science team produced the Bitcoin Sharpe Signal. This automated, quantitative trading strategy is both firmly grounded in data derived from the blockchain and tailored to capture the unique opportunities presented by the Bitcoin market.
The Bitcoin Sharpe Signal not only validates the utility of such data but also provides clear, actionable insights for investors, proving its value in navigating the digital asset market.
What Is On-Chain Data and How Glassnode Uses It For Trading
Unlike traditional market data, which focuses mostly on price movements, on-chain metrics provide a real-time pulse on digital asset ecosystems. These metrics reveal investor behaviours and market trends that traditional indicators might miss, offering a more in-depth lens and, potentially, a better indicator for future movements. By integrating these insights through machine learning, Glassnode has identified metrics with the most predictive potential for a long-only Bitcoin trading strategy.

The core of Glassnode’s innovative approach is a supervised machine learning model that methodically analyzes on-chain data to assess their correlation with Bitcoin market movements. This model stands out for its transparency, allowing investors to understand how trading rules are derived from blockchain activities. It sifts through vast datasets to identify the on-chain metrics most indicative of future price actions.
The model emphasizes feature importance to determine which on-chain metrics have the strongest correlation with future Bitcoin price movements. Among the various metrics analyzed, the percentage of entities in profit and the Short Term Holder Profit Ratio (SOPR) emerged as the most promising indicators for adopting a long position in Bitcoin.
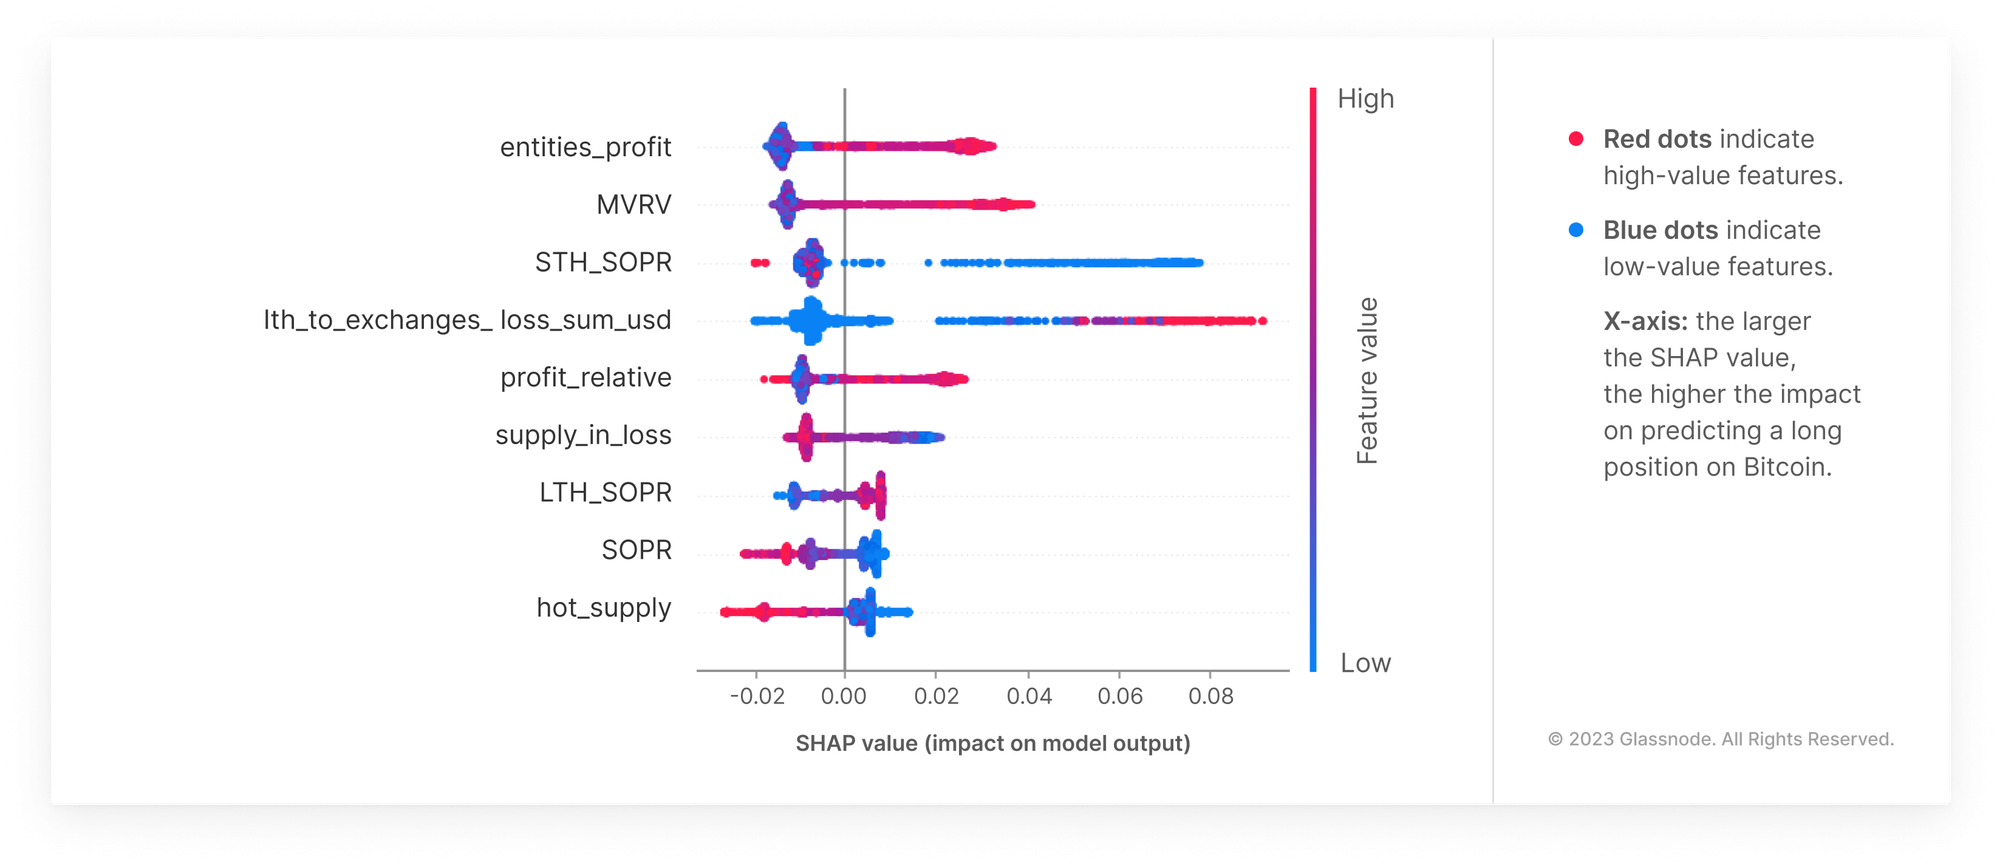
The percentage of entities in profit is a critical metric as it reflects the overall market health and investor sentiment. A high percentage suggests that the majority of market participants are in a favourable position, potentially signalling sustained market confidence and a bullish outlook.
On the other hand, the Short Term Holder SOPR focuses on the profitability of recent transactions, providing insights into the behaviour of short-term investors. When SOPR indicates that short-term holders are seeing profits, it often precedes periods of positive market momentum, making it a valuable predictor for timing entries into long positions.
Disclaimer: For intellectual property protection, we disclose only the foundational metrics, such as STH-SOPR and the percentage of entities in profit, without detailing the specific transformations and parameters applied in our trading strategy development. Consequently, the direct application of these base metrics alone does not replicate the outcomes achieved by our sophisticated live trading model.
Unveiling the “Goldilocks Zone”
The “Goldilocks Zone” refers to the optimal conditions identified by Glassnode’s model for initiating long positions in Bitcoin, pinpointed using SHAP (SHapley Additive exPlanations) values. These values quantify the impact of specific on-chain metrics – such as the percentage of entities in profit and Short Term Holder Profit Ratio (SOPR) – on the model’s decision-making process, revealing critical thresholds that signal ideal buying opportunities. By analyzing SHAP values, the model discerns precise conditions under which the market is neither overextended nor overly bearish, like the “just right” scenario of the Goldilocks principle.

From this analysis, a heuristic is derived, simplifying the complex model into a more accessible strategy without sacrificing its analytical depth. This heuristic, while streamlined, preserves the core insights of the model, offering investors a transparent and effective approach to trading Bitcoin.
This approach has been solidified and encoded into the Bitcoin Sharpe Signal. It encapsulates the essence of the model’s findings, providing a clear guide for identifying high-probability entry points based on the nuanced understanding of market dynamics facilitated by on-chain data analysis.
Performance Insights and Strategy
The model employed by Glassnode is designed with a conservative approach, prioritizing risk minimization while capturing upward market trends with precision. Consequently, the strategy created based on the model balances the potential for gains with the imperative to protect against downside risk.

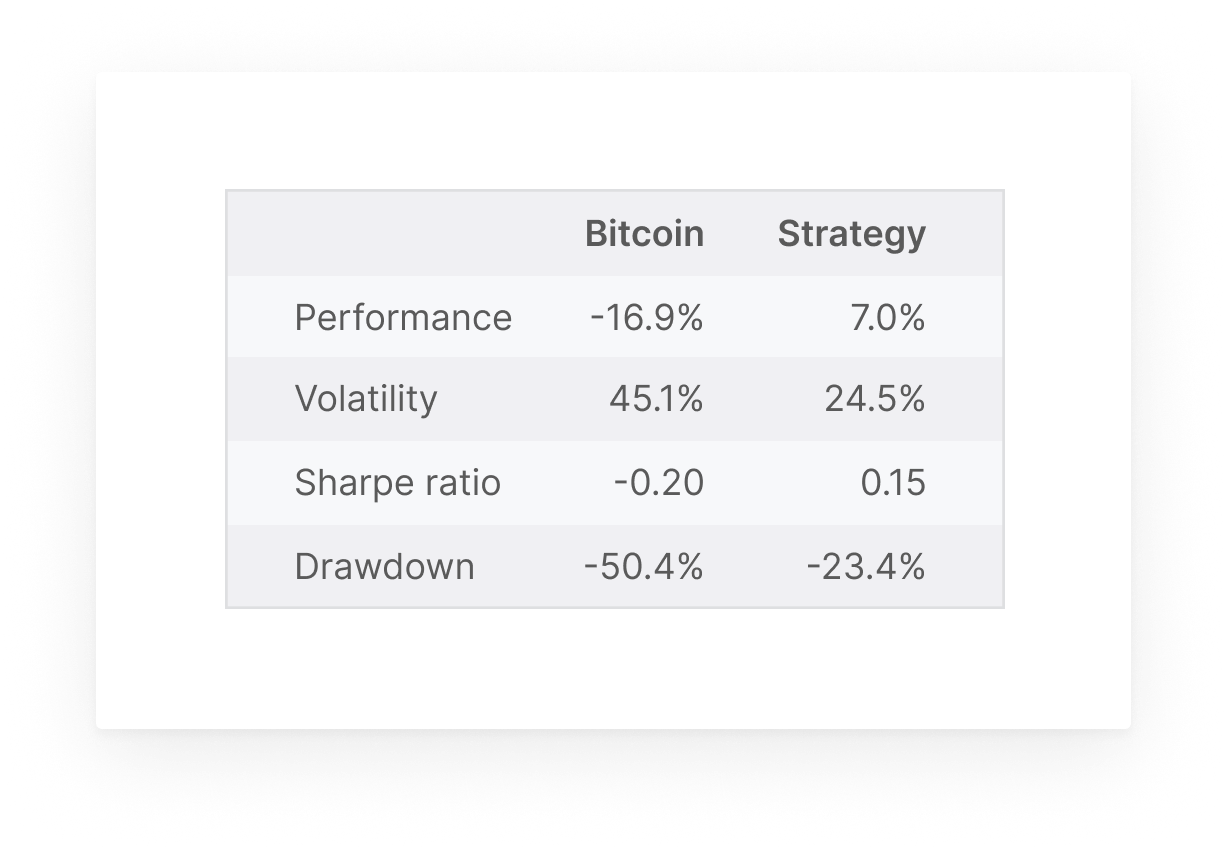
The Bitcoin Share Signal’s out-of-sample performance, a rigorous test of its predictive capabilities, highlights its success in navigating the volatile Bitcoin market. By analyzing data that wasn’t used in the training phase, the model has demonstrated a consistent ability to identify profitable trading opportunities, underscoring the substantial predictive power of on-chain data. This performance validates the model’s strategic approach and reinforces the value of incorporating on-chain analytics into a variety of trading frameworks.
Dive Deeper with Live Performance Tracker
The Bitcoin Sharpe Signal by Glassnode is designed with a conservative approach, prioritizing risk minimization while capturing upward market trends with precision. Consequently, the strategy created based on the model balances the potential for gains with the imperative to protect against downside risk.
We encourage interested parties from traditional and digital finance sectors to review the model’s live performance data** and consider a trial of our on-chain analytics services. For further details or to engage with our analytics solutions, please reach out to our institutional sales team.
Disclaimer: This report does not provide any investment advice. All data is provided for information and educational purposes only. No investment decision shall be based on the information provided here and you are solely responsible for your own investment decisions.
** The Dashboard containing Signal’s daily performance is currently available to Glassnode Enterprise customers only.
- SEO Powered Content & PR Distribution. Get Amplified Today.
- PlatoData.Network Vertical Generative Ai. Empower Yourself. Access Here.
- PlatoAiStream. Web3 Intelligence. Knowledge Amplified. Access Here.
- PlatoESG. Carbon, CleanTech, Energy, Environment, Solar, Waste Management. Access Here.
- PlatoHealth. Biotech and Clinical Trials Intelligence. Access Here.
- Source: https://insights.glassnode.com/the-predictive-power-of-glassnode-data/

