Executive Summary
- Bitcoin bulls have managed to push BTC prices back to $35k, breaking several key technical and on-chain pricing levels which were co-located around $28k, a noteworthy sign of strength.
- Derivatives markets contributed to the move with a pair of short-squeezes, closing out of 60k BTC worth of futures positions, and a $4.3B surge in options call open interest.
- Long-term investors are unphased by this weeks price action, with Long-Term Holder supply reaching new ATHs, and revived supply volumes remaining insignificant.
Bitcoin investors have seen their holdings appreciate meaningfully this week, with BTC rallying from a low of $27.1k to a high of $35.1k. This move started off with a convincing break of several important technical and on-chain pricing levels on the way, making for a noteworthy sign of strength.
A cluster of long-term simple moving averages of price are located around $28k, and have provided market resistance through September and October. After a month of the market grinding higher, the bulls found sufficient strength this week to convincingly break through the 111-day, 200-day, and 200-week averages.

Are Derivatives The Driver?
When significant market moves take place, analysts often consult derivatives data to establish if the move was driven by a leverage wash-out. First we will look at open interest in perpetual swap markets, which we consider in BTC terms to filter out the effects of coin price movement.
Open interest did decline by around 25k BTC on 17-Oct, which is a reduction of around 8.3%. This was followed by a second major leverage washout of 35k BTC on 23-Oct as the market rallied to new yearly highs of $35k. This leverage squeeze is now of a magnitude similar to the short-squeeze in January, and the long-squeeze in August.
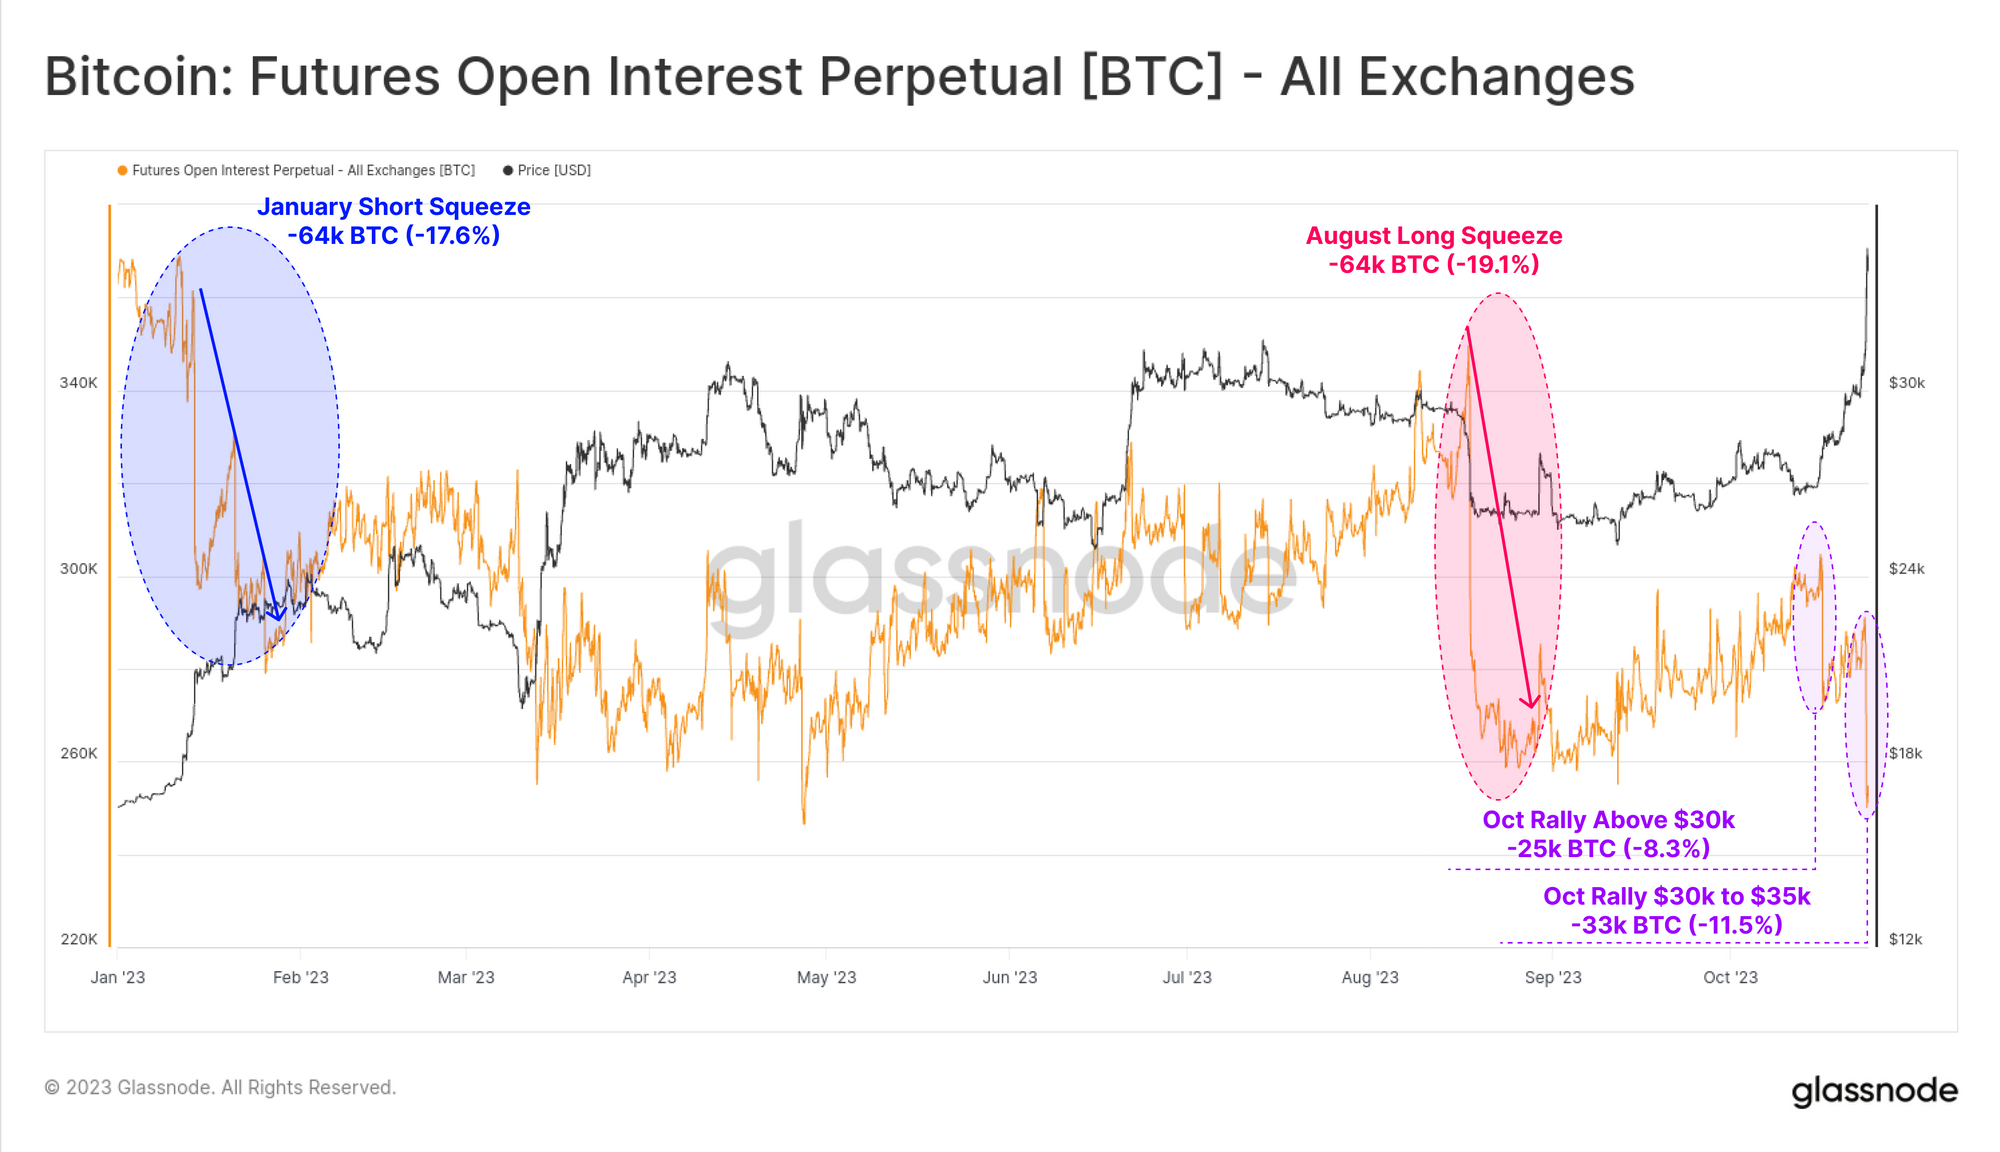
Approximately $56M in short positions were liquidated when the rally kicked off on 17-Oct, and followed by an additional $125M on 23-Oct. This is a meaningful short liquidation volume within the context of 2023. It is again comparable to the $155M in short liquidations in January and the $220M in long positions closed in August.

We can inspect futures liquidation volumes another way by taking the 30-day sum of liquidated longs, shorts, and computing the net balance. We can see that most of 2023 (and indeed most history) is dominated by greater long liquidation volumes compared to shorts.
On net, the market has now seen more short volumes force-closed over the last 30-days. The chart below highlights these points of such ‘short-dominance’, which have historically coincided with local market extremes.

Of note is that funding rates and cash-and-carry basis in futures markets have remained relatively calm all things considered. 2023 has generally seen futures markets yield annualized rates in excess of 6%, which are greater than US treasury rates.
The sell-off in August cooled this long bias substantially, with perpetual funding rates dropping from 7.5%+ to +2.5%. Whilst funding rates have spiked during the short squeezes this week, is has remained relatively low, suggesting the rally may be only partially driven leveraged speculation.

Options markets however continue to be a destination for speculative capital. Open interest in call options has surged by $4.3B, expanding by 80% to reach over $9.7B in total. This suggests that traders and investors continue to use options markets as a preferred instrument for long exposure. This is a relatively new development in Bitcoin market structure, where options markets are now of a comparable scale to futures (see WoC 32).

Taking Out Key Cost Basis Levels
Not only did this week’s rally clear several long term technical analysis price levels, it has also found footing above two important on-chain cost basis models. Analysts can consider these ‘cost-basis’ models in a similar light to technical levels in that they reflect zones of psychological importance, and thus an area where investor behaviour may shift.
In our recent Cointime Economics research developed alongside ARK-Invest, we established the True Market Mean Price as an ideal candidate for an average investor cost-basis model. This model is currently trading at $29.78k, and has historically, seen the Bitcoin market trade half its time above, and half below this level.
With the market having cleared the 2020-22 cycle mid-point (see WoC 28), as well as trading above the True Market Mean Price, this puts the average active BTC investor back into an unrealized profit.

The Short-Term Holder (STH) cost basis is also now in the rear view mirror at $28k, putting the average recent investor into an average profit of +20%. The chart below shows the STH-MVRV Ratio, where red denotes periods where the market traded below the STH cost basis, and green above it.
We can see instances in 2021-22 where STH-MVRV reached relatively deep corrections of -20% or more. Whilst the August sell-off did reach a low of -10%, it is noteworthy how shallow this MVRV decline is by comparison, suggesting the recent correction found noteworthy support, being a precursor to this weeks rally.

Whilst MVRV describes the profitability of coins held by Short-Term Holders (unspent supply), it has a sibling indicator called SOPR which describes the profitability of coins that were spent by STHs (spent supply).
We can similarly compute a ‘Spent Cost Basis’, to ascertain the average acquisition price for the coins transacted by the STH cohort. In other words, we are assessing the price that spent coins ‘came from’.
We see a similar pattern to MVRV, with a relatively shallow SOPR drawdown compared to 2021-22, and a swing back into positive territory this week. This suggests that investors did not express the same degree of panic and fear as they did in the 2022 bear market proper, another sign of investor resilience.

If we bring these two cost basis models together, we can establish an oscillator that tracks the trend of Short-Term Holder confidence (explored further in WoC 38).
What we can see is that after hitting the most negative value since January (when prices were ~$16k), investor confidence has recovered to neutral, meaning STHs who are spending have a similar cost basis to those who are HODLing. We are also on the verge of a positive cross-over of these cost basis models.

How Did Long-Term Investors React?
The final question we will address is how longer-term investors have reacted to this rally, and how their aggregate positioning has changed.
With the market approaching YTD highs, a significant proportion of the supply has now recovered from being held ‘in-loss’ to ‘in-profit’. The percent of supply in profit jumped by a massive 4.7M BTC, equivalent to 24% of the total circulating supply. This provides insight into the volume of coins which changed hands, and have a cost basis between $27k and $35k.
With 81% of the supply now in profit, the market has now returned to positive gear, with this metric now being above the long-term average for this metric (shown in green).

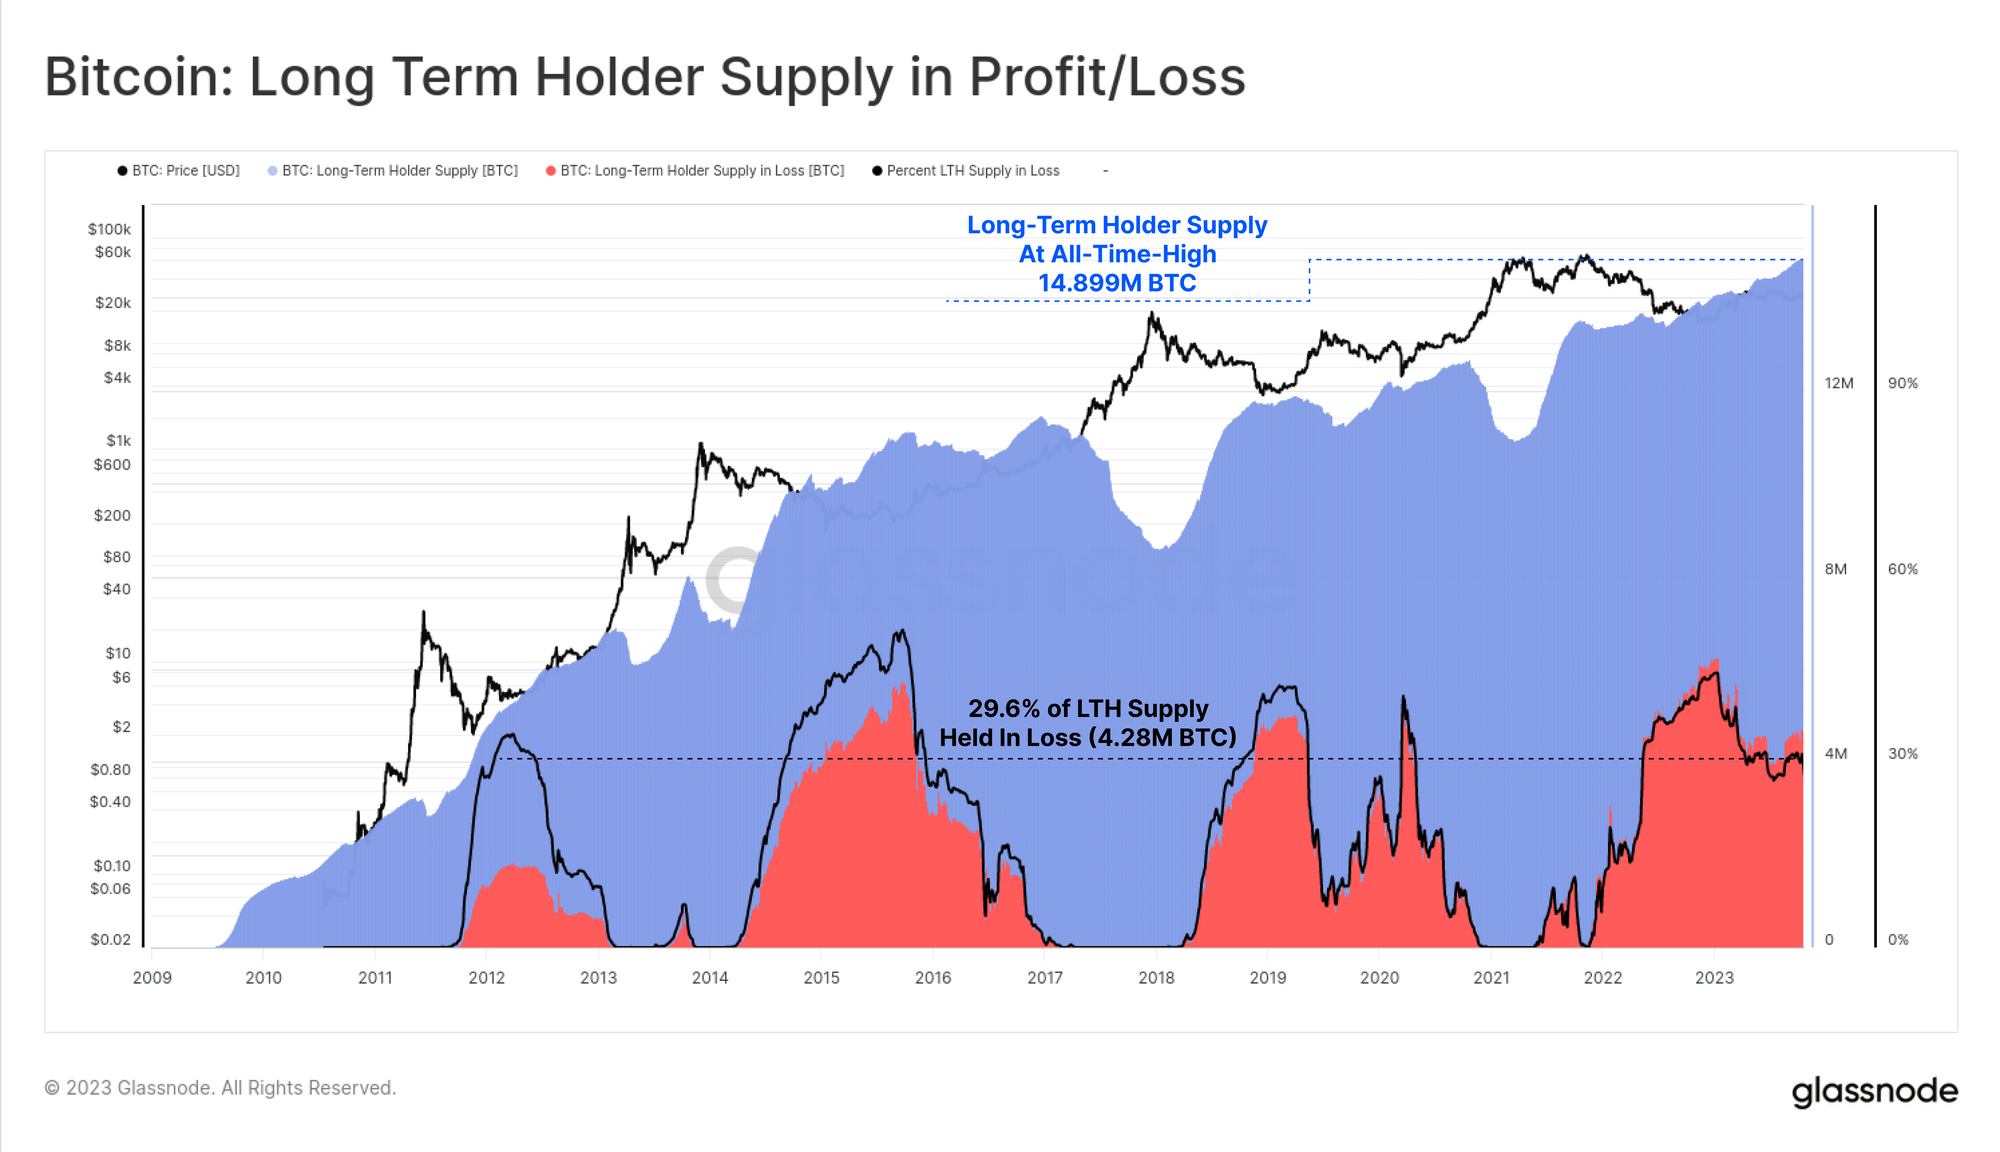
For the Long-Term Holder cohort, they appear impressively unaffected by this weeks rally, seeing their aggregate holdings break to a new all-time-high of 14.899M BTC. The continued climb of this metric indicates that a larger volume of supply is maturing across the 155-day holding threshold than is being spent out of it.
Approximately 29.6% of LTH Supply is held at a loss, which is actually historically high for this metric given the strong market uptrend since the 2022 lows. This is similar to late 2015 and early 2019, and the March 2020 bottom.
This suggests that the LTH cohort may well be a more hardened and firm handed cohort compared to prior cycles.
Lastly, we will look at a Z-Score (2yr period) transformation of the Revived Supply metric. We are seeking periods where coins which have been held for longer than 1yr are spent at a statistically significant rate compared to the prior 2-yrs (half a halving cycle).
Periods of high expenditure (green) often correlate with maximum profit taking (uptrends) or panic selling (downtrends). However today, this metric suggests we remain within a regime of coin dormancy, with a negative z-score reading, indicative of minimal volumes of revived supply reacting to this week’s events.

Summary and Conclusions
Bitcoin prices have reached new yearly highs, breaking back above the mid-cycle price level of $30k, and accelerating to $35k. The market found sufficient strength to break above several important pricing levels including the 200-day average, 200-week average (both technical), True Market Mean Price, and Short-Term Holder cost basis (both on-chain).
A meaningful proportion of supply and investors now find themselves above the average break-even price, located around $28k. This sets the foundation for a resumption of the 2023 uptrend. At the very least, the market has crossed over several key levels where aggregate investor psychology is likely to be anchored, making the weeks that follow important to keep an eye on.
Disclaimer: This report does not provide any investment advice. All data is provided for information and educational purposes only. No investment decision shall be based on the information provided here and you are solely responsible for your own investment decisions.

- SEO Powered Content & PR Distribution. Get Amplified Today.
- PlatoData.Network Vertical Generative Ai. Empower Yourself. Access Here.
- PlatoAiStream. Web3 Intelligence. Knowledge Amplified. Access Here.
- PlatoESG. Carbon, CleanTech, Energy, Environment, Solar, Waste Management. Access Here.
- PlatoHealth. Biotech and Clinical Trials Intelligence. Access Here.
- Source: https://insights.glassnode.com/the-week-onchain-week-43-2023/

