Posted December 19, 2023 at 2:45 pm EST.
When revelers rang in 2023, bitcoin (BTC) was hovering around $16,600 and crypto investors were licking their wounds following the collapse of crypto exchange FTX. The new year looked set to be muted relative to the heady years of crypto past, but, as investors who have been around the block know, it’s rarely quiet in crypto, and 2023 has been no different.
From industry layoffs to heightened regulatory scrutiny to the failures of three crypto-friendly banks to the mesmerizing criminal trial of FTX founder Sam-Bankman-Fried and the euphoria over the potential approval of a spot bitcoin exchange-traded fund in the US, 2023 has had a little bit of everything.
Read more: Crypto’s Best and Worst in 2023: The Chopping Block
With as many ups and downs as an alt-coin trading chart, Unchained asked some of the industry’s leading research firms to share the charts and data that best tell the story of crypto in 2023.
1) Global Crypto Adoption Falls
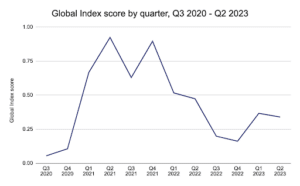
Global Crypto Adoption Index chart, which sums together the index adoption scores of 154 countries per quarter. (Chainalysis)
Blockchain data platform Chainalysis’s global crypto adoption index is a measure of the global grassroots adoption of crypto. Chainalysis measures 154 countries’ usage of different types of cryptocurrency services by ranking the countries across five sub-indexes. The data is then collated to generate a final score for each country on a scale of zero to one. The closer the score is to 1, the higher the country ranks in adoption.
The overall global index score, which sums the 154 countries’ index scores for each quarter, highlights that the industry still has a long way to go in terms of grassroots adoption after a dramatic fall in 2022, which was a year mired by industry collapses.
“While significant improvements have been made, there is still a long way to go to get back to 2021’s peak,” said Chainalysis’s research team.
2) Central and Southern Asia Region Is Bright Spot in Adoption
Chainalysis analysts are closely watching the Central and Southern Asia and Oceania (CSAO) region. Though the region only accounts for around 20% of global activity, it boasts the largest purchasing power and population, which has led to six of the top 10 countries in Chainalysis’s index being located in the region, the analysts said.
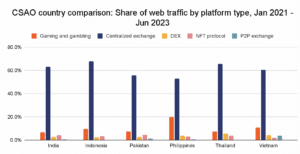
Comparison of the digital assets web traffic of CSAO countries. (Chainalysis)
“Not only is the region’s adoption rapidly growing but the reasons why are also very varied,” said Chainalysis’s research team. “The Philippines, for example, is particularly interested in using digital assets for gaming and gambling, while Vietnam is the only country with a strong interest in P2P exchanges. These are key factors in predicting how the industry will evolve next year and beyond.”
Read more: To See Where Web3 Gaming Is Headed, Look to the Philippines
3) Liquidity Continues to Be a Challenge
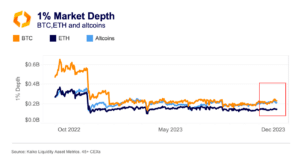
Market depth across bitcoin, ether and altcoins order books. (Kaiko)
Market depth is a measure of the number of open buy and sell orders for an asset. The larger the number of orders, the greater the depth of the market, which means that large trades are less likely to impact an asset’s price. It’s one of the best indicators of liquidity, said Clara Medalie, research director at crypto data firm Kaiko.
“After the FTX collapse, liquidity collapsed across exchanges, and we can see that it has yet to recover,” Medalie said.
Surprisingly altcoin liquidity has seen the largest recovery, while bitcoin has only seen a slight increase in market depth, which is largely due to price effects, and ether (ETH) has struggled, Medalie said.
Liquidity has also become more concentrated this year due to a more difficult environment for centralized exchanges. The eight largest exchanges account for around 89% of crypto trade volumes and 91% of market depth, according to Kaiko data.
“Overall, liquidity still poses a challenge as we move into 2024,” Medalie said.
4) Bitcoin Solidifies Its Status as an Alternative Asset
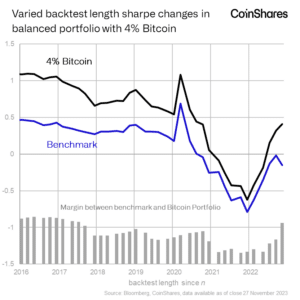
Sharpe ratio of a portfolio with 4% bitcoin versus one without. (Coinshares)
This year digital asset investment firm Coinshares observed a dramatic widening in the gap between the Sharpe ratio of a portfolio containing 4% bitcoin and one without, which means that the portfolio with bitcoin offered better risk-adjusted returns.
The Sharpe ratio is a widely used measure for risk-adjusted returns – the higher the ratio, the better the returns. A Sharpe ratio greater than one is considered to be good.
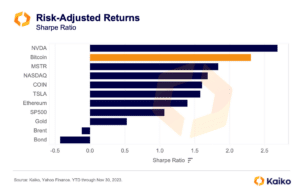
Sharpe Ratio year-to-date measure across assets. (Kaiko, Yahoo Finance)
“The rising correlation between bond and equities [is] driving the need for greater diversification, with bitcoin offering the best diversification and risk-adjusted returns of all alternative assets,” said James Butterfill, head of research at Coinshares.
5) Bitcoin Matures as an Asset
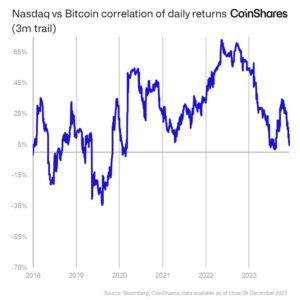
Correlation between Nasdaq index and bitcoin daily returns. (Coinshares)
Meanwhile, bitcoin’s own correlation with the Nasdaq index has fallen below 5%, Butterfill said. This is a shift from the 2020-21 bull cycle in which bitcoin’s price was heavily correlated with US equities. The correlation is now staying within long-term historical norms, he added.
“The increasing softness in rate hikes this year and deteriorating macro data have led to a divergence between bitcoin and equities prices,” Butterfill said. “This is likely to continue as the Fed takes a softer stance in 2024.”
“Bitcoin has outperformed most traditional assets, including gold and tech stocks,” Kaiko’s Medalie said. “The steady decline in bitcoin volatility, which hit multi-year lows this summer, has likely contributed to the trend. Overall, bitcoin was this year’s winner across the board.”
6) Investment Flows Recover
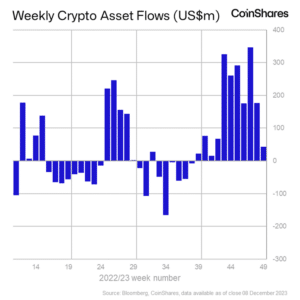
Digital asset investment product inflows by week. (Coinshares)
Despite the chilly crypto winter in the early part of 2023, digital asset investment products recently experienced their eleventh straight week of inflows, said Coinshares’ Butterfill.
The total amount of inflows so far this year is $1.85 billion, which makes it the third-largest year of inflows and the most since the 2021 bull market, Butterfill said.
7) Institutional Capital Starts to Return
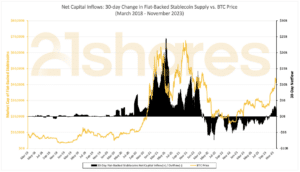
30-day change in fiat-backed stablecoin supply vs bitcoin’s price. (21Shares, Glassnode, DefiLlama)
Crypto investment firm 21.co has also identified a return of institutional capital into crypto markets late this year through its measurement of the 30-day change in fiat-backed stablecoin supply. This metric acts as a good proxy for measuring new waves of capital entering the ecosystem and has historically positively correlated with bitcoin’s price movements, said Carlos Campos, research analyst at 21.co.
“Recent net inflows into stablecoins suggest a changing market structure going into 2024, with institutional money returning to the ecosystem rapidly,” Campos said.
8) NFTs Struggle
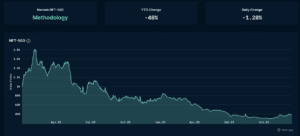
Nansen’s NFT-500 index, which measures the top 500 NFT collections. (Nansen)
2023 was a rough year for the non-fungible token (NFT) market with average prices down 48% year-to-date based on data from blockchain analytics platform Nansen, whose NFT-500 index tracks the top 500 NFT collections.
9) Pudgy Penguins Buck the Trend
One notable exception to the NFT trend was the Pudgy Penguin NFT collection, which was acquired by Luca Netz in April 2022. The collection made a number of significant announcements this year including the rollout of a series of physical products in 2,000 Walmart stores across the US, as well as various Canadian Toys R Us locations. The collection also announced that its virtual world will launch next year.
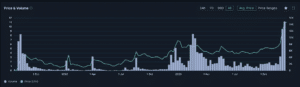
Price and volume of Pudgy Penguins NFT collection. (Nansen)
“Pudgy Penguins saw a shallower drop in their average price throughout the year and a large move up towards the end of the year,” said Martin Lee, content and communications lead at Nansen.
10) A Shake-up in Centralized Exchanges
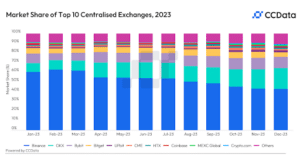
Market share across centralized exchanges. (CCData)
“Looking back on 2023, we have witnessed a remarkable structural shift in the centralized exchange landscape,” said Joshua de Vos, research lead at digital asset data provider CCData.
The collapse of FTX resulted in the market consolidating behind Binance, which reached an all-time high market share of 62.6% across spot and derivatives in February. Then as legal and regulatory actions were taken against Binance throughout the year, the exchange’s combined market share waned, falling for 10 consecutive months to 42.7% in December.
“Contrastingly, both OKX and Bybit have benefited from this displacement of market share, reaching all-time highs in November of 20.2% and 11.9%, respectively,” de Vos said.
11) Ethereum Staking Hits New Highs
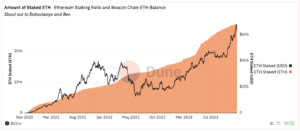
Amount of staked ether (21.co, Dune Analytics)
“Regarding Ethereum fundamentals, the amount of staked ether hit an all-time high of 28.78 million ether in December, equivalent to over $60 billion securing the network,” said 21.co’s Campos. “Since the Shanghai upgrade, the Ethereum staking contract surpassed 10 million ether in net new deposits, which shows that enabling withdrawals was one of the most significant de-risking events in Ethereum’s history.”
12) Solana Stages a Comeback
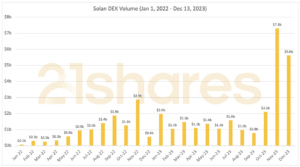
Decentralized exchange trading volumes on Solana (21Shares, DefiLlama)
Trading volumes on decentralized exchanges on Solana reached an all-time high of $7.3 billion in November and December looks on track to surpass this figure, according to data from 21.co. This activity comes amid airdrops from key Solana projects including Jito, Pyth and Jupiter.
ARVE Error: src mismatch
provider: youtube
url: https://www.youtube.com/watch?v=xwFBD2hzChk&t=361s
src in org: https://www.youtube-nocookie.com/embed/xwFBD2hzChk?start=361&feature=oembed
src in mod: https://www.youtube-nocookie.com/embed/xwFBD2hzChk?start=361
src gen org: https://www.youtube-nocookie.com/embed/xwFBD2hzChk
“After being plagued by outages in 2021 and 2022, Solana faced its most significant challenge after FTX collapsed in November 2022,” said 21.co’s Campos. “With many people calling for the death of the chain and its future at stake, the Solana community stood together and rose to the occasion.”
- SEO Powered Content & PR Distribution. Get Amplified Today.
- PlatoData.Network Vertical Generative Ai. Empower Yourself. Access Here.
- PlatoAiStream. Web3 Intelligence. Knowledge Amplified. Access Here.
- PlatoESG. Carbon, CleanTech, Energy, Environment, Solar, Waste Management. Access Here.
- PlatoHealth. Biotech and Clinical Trials Intelligence. Access Here.
- Source: https://unchainedcrypto.com/12-charts-that-tell-the-story-of-crypto-in-2023/

